Can Buying a Stock That Gaps Lower Give You An Edge?
How many of you have turned on your favorite financial news
show to hear a list of stocks that are set to open higher due to “bullish news”.
You’re told stock XYZ is due to open 10% higher than it closed the previous day
and shown a crowd that has gathered around the post where XYZ’s market makers are eagerly
awaiting the market open. If you own the stock, you’re probably thinking this is
great news, and if not, you’re probably thinking about buying it. But then you
think about the last time this happened and recall how the stock actually closed
lower that very day. So what happened? Surely all the bullish
news means XYZ is going higher…or does it?
In this article, we are going to share with you some of our most recent research
into the relationship between a stock’s opening price and its closing price the
previous day. Our goal is to find out if this relationship provides you with
information that can be used as part of a trading strategy? Well, we think it
does, and here’s why…
Most traders are familiar with market gaps/laps but for those
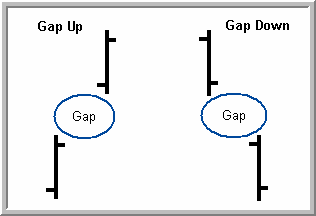
that are not, here’s a brief description. A “gap up” occurs when a stock’s
opening price is above the previous day’s high and a “gap down” occurs when a
stock opens below the previous day’s low (see figure 1).

Figure 1
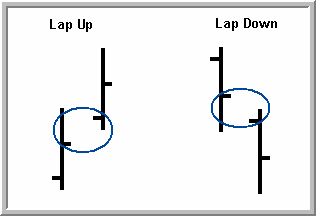
A “lap up” occurs when a stock’s opening price is above the
previous day’s close and a “lap down” occurs when a stock opens below the
previous day’s close (see figure 2).

Figure 2
Very often a
“gap up” is accompanied by bullish news, like a positive earnings surprise,
takeover rumor, hot new product launch, etc. The news will often be accompanied
by an analyst
appearing on one of the financial news networks talking about the bullish price action
and how it will likely lead to higher prices. Unfortunately this insight is
rarely backed up by any sort of quantitative results that can confirm or deny if
the statement is accurate.
Here at TradingMarkets we take a different approach. We feel that before we
trade, it’s important to know how the pattern, or setup, we are looking at has
performed in the past. That way we can objectively assess whether the trade
offers a good risk reward opportunity and what might happen in the
future. In doing so, we are able to determine a number of important variables:
- Number of Trades
- Avg. % Profit/Loss
- Avg. % of Winners
- Winners Avg. % Profit
- Avg. % of Losers
- Losers Avg. % Loss
We looked at over seven million trades from 1/1/95 to 6/30/06*.
The table below shows the average percentage gain/loss for all stocks during our
test period over a 1-day, 2-day, and 1-week (5-days) period. These numbers
represent the benchmark which we use for comparisons.
| Time Period | Gain/Loss |
| 1-day | 0.05% |
| 2-days | 0.10% |
| 1-week | 0.25% |
Using the information above we decided to research what
really happens to stocks that form gaps/laps.
Gaps
We looked at “gaps up” ranging from 2.5% to more than 25% (in
other words, the stock opened today 25% higher than the previous day’s high). Such extensive research produced far too much data to present
in one article, but the results revealed a number of interesting findings, some of which
are highlighted here:
- The average returns of
stocks that “gap up” were negative 1-day, 2-days and 1-week later. In other words, on average, “gaps up” should
not be bought. - The average returns of
stocks that “gap down” were positive. These results were even more pronounced
when we looked at “gaps down” of 10% or more. That means traders should look to
build strategies around stocks that “gap down” by 10% or more.
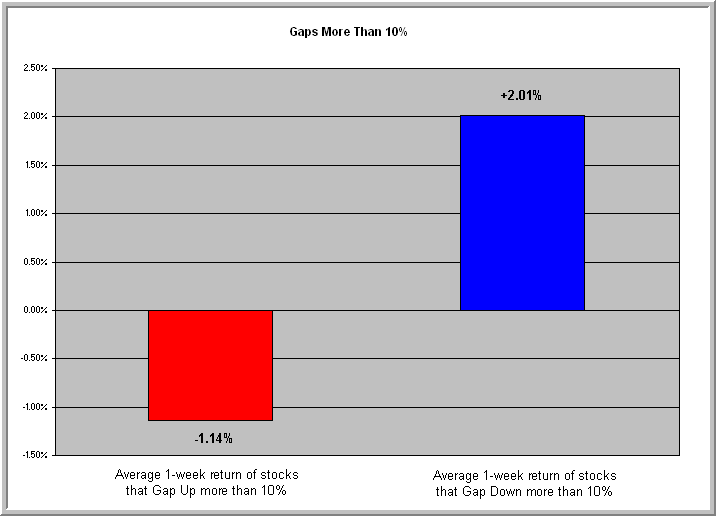
Graph 1 shows one example of what we found. This shows the average 1-week return
of stocks that Gap Up or Gap Down by 10% or more.

Graph 1
As you can see, on average, stocks that Gap Up more than 10% show
a negative return over the next week (-1.14%). By comparison, on average, stocks
that Gap Down more than 10% show a positive return (+2.01%).
Why is this so? As
mentioned earlier, a “gap up” is usually accompanied by bullish news of some
sort, strong earnings, takeover speculation, etc. But this supposedly bullish
news, on average, has not led to higher prices, so what’s really going on? Most
likely the “gap up” represents the last surge of buying, mainly by retail
investors, when in reality the real buying has already occurred.
On the flip side, “gaps down” are usually accompanied by negative news, like
lower than expected earnings, a product recall, new legislation, a lawsuit being
filed, etc. The news causes investors to panic and rush for the exits. This
emotionally driven type of selling results in the “gap down” but, once again, it
represents the last wave a selling. The real selling has already occurred and
now is the time that experienced traders, money managers and most of all, market
makers are actually buying.
Laps
Our research into laps produced more of the same results. Laps
Up displayed a negative bias, while laps down
displayed a positive bias. Once again the results
showed a significant difference between the benchmarks and the results.
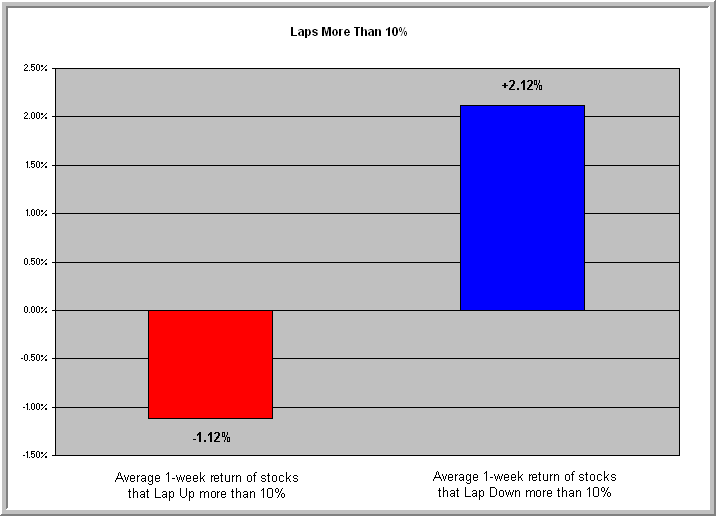
Graph 2 shows another example of what we found. This shows the average 1-week
return of stocks that Lap Up or Lap Down by 10% or more.

Graph 2
As you can see, on average, stocks that Lap Up more than 10% show
a negative return over the next week (-1.12%). By comparison, on average, stocks
that Lap Down more than 10% show a positive return (+2.12%).
The
characteristics of laps and gaps are so similar, that the news surrounding laps
up/down is much the same as it is surrounding gaps up/down.
News is usually bullish when stocks make “laps up” and bearish when stocks make “laps
down”. Once again, this news leads most investors, including institutional
investors, to be buying and
selling at precisely the wrong time!
The examples shown above represent just the tip of the iceberg. We found even
greater opportunities by adding simple conditions, like stocks trading above or
below the 200-day moving average, combining laps/gaps with
PowerRatings,
etc. And, while some
setups offered greater risk/reward profiles than others, the underlying results
were the same every time. In other words, the results were robust and
conclusive.
Our research showed time and again, across almost every possible
parameter, that the notion gaps/laps up are bullish, and gaps/laps down are
bearish is incorrect.
The statistics clearly show that, on average, it has been better to be a buyer of Gaps/Laps
Down, rather than Gaps/Laps Up.
Ashton Dorkins is
Editor-in-Chief of TradingMarkets.com.
Larry Connors is CEO and Founder of TradingMarkets.com,
and Connors Research.
* Our research looked at 7,050,517 trades since Jan
1, 1995. We applied a price and liquidity filter that required all stocks be
priced above $5 and have a 100-day moving average of volume greater than
250,000 shares.
