Capre: The Ichimoku Report
EUR/USD
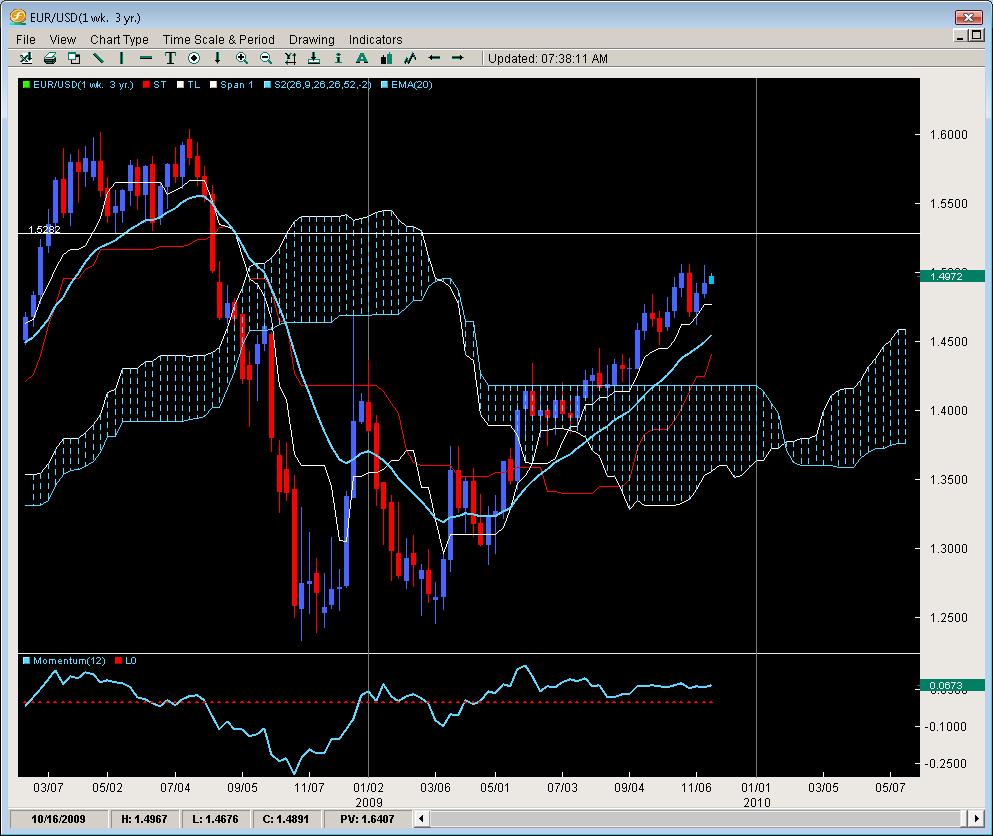
Not quite trotting in place like a show pony but being rejected at the new highs while making mild gains on the week, the pair has yet to close above the big figure at 1.5000 which we feel is the first requirement for new buyers to come in. The 2nd requirement will be breaking a closing above the yearly highs at 1.5061. If these two events should occur, then we expect a run up to 1.5281 which was the double bottom in the summer of 08′. Any weekly closes above this level suggest the 1.6000 barriers will likely be under attack and really challenge the previous notion in the banking world that EUR/USD is ‘protected’ at 1.6000 from going any higher. The angle of this trend and the lack of closing or even piercing below the weekly tenkan suggest the trend is alive and well but has the aforementioned hurdles to spark new technical buying. Any weekly closes below the Tenkan would be the first sign of trouble and the 20ema will be the next defense levels tested. Momentum models suggest the pair should continue doing what its doing like being on cruise control but a break below the zero line on momentum could be the start of some serious unwinding.
GBP/USD
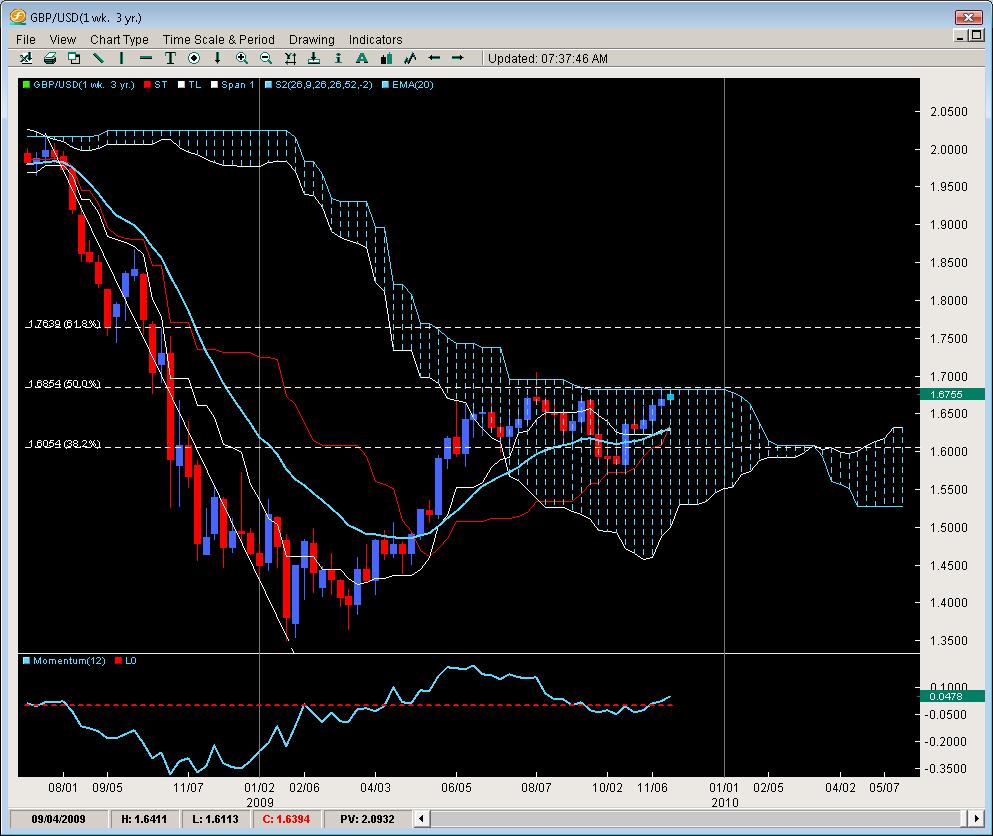
Posting its first 4week gain in a row for 2009, the move is consistent yet tentative. The pair has yet to close above the weekly Kumo flat top which we feel would be an interesting catalyst for potentially new buying. If it closes and holds above the flat top, this would likely push the pair higher to challenge 1.7000. Why is this flat top so hard to break? Because it also represents the 50% fib level of the 2.0151 – 1.3500 downmove so any closes above here trigger two technical events which leave scope for the 61.8% fib to come into play likely in the 1st Q of 2010. A strong break but rejection above the Kumo will likely send the pair to the weekly 20ema just under 1.6400 and challenge the base building there.
AUD/USD
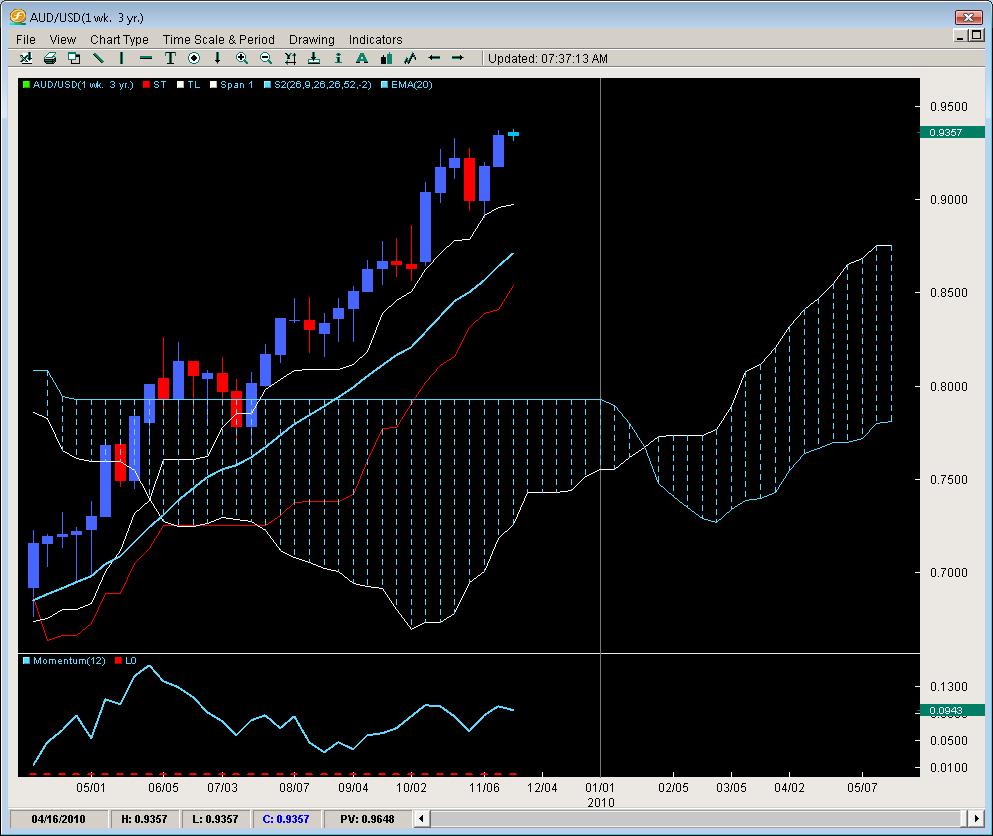
Bouncing off the weekly Tenkan as if the pair was just looking for a reason to be bought up, the pair literally touched the Tenkan, went 12pips past it, then launched and closed 272pips higher. The pair followed suit the following week buy opening and not making a single pip lower from the open to close above the yearly high (was .9326) closing at .9341. This should reconfirm to buyers the trend is still in play but is not really running on a lot of new buying, just the current momentum is still in play carrying the pair. Momentum models combined with Ichimoku Analysis suggest that until the pair closes below the weekly Tenkan, we still want to be buying as the best the pair has been able to do is close two weeks down in a row while producing 5 and 10 week stretches of nothing but gains starting in March of this year. This thing is still trucking and has not shown its ready to give up yet.
USD/CAD
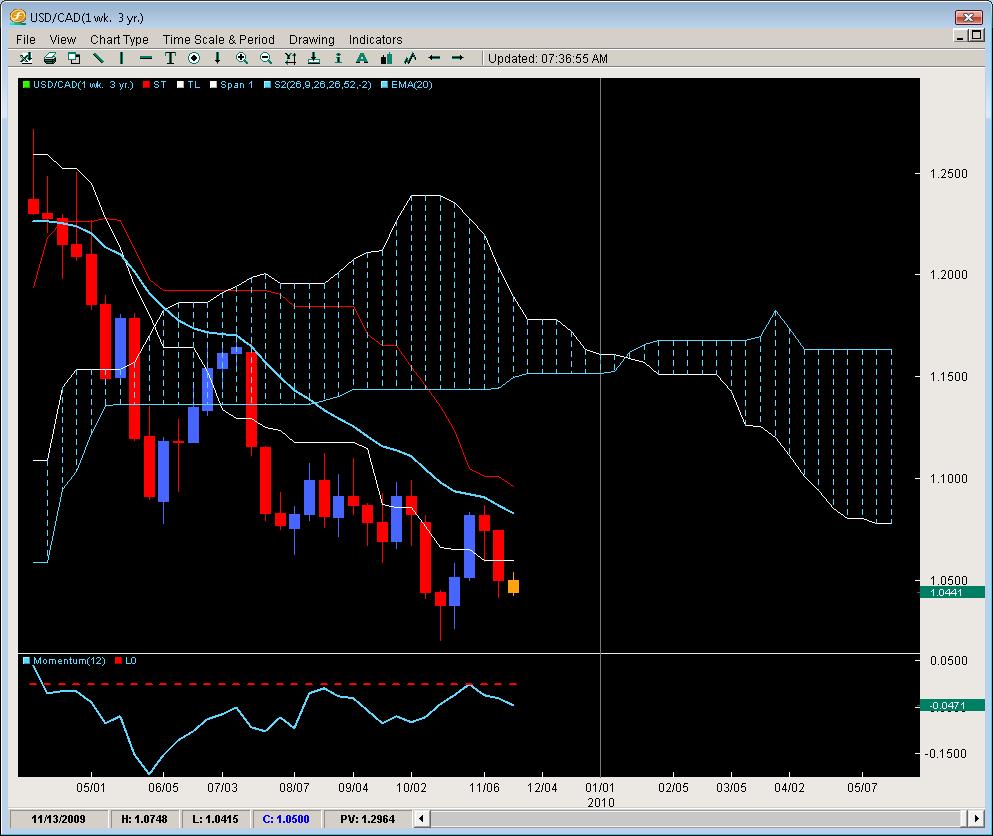
Rejecting ‘before’ the pair reached the weekly 20ema, the pair has dropped for two straight weeks and is opening the third threatening to take out the previous weekly lows. If it can muster this feat, the yearly lows at 1.0200 will likely come under attack but the strategy for the pair is simple – wait for a rejection close to the 20ema (weekly chart) and use the Tenkan as the 1st target and the lows for the last 6 weeks as the 2nd target. The pair is making an effort to gain some upside but every strong thrust is continually met with more selling so we like finding rallies and playing for more downside. If the pair fails to close above the 20ema by the end of the year, we suspect it will have one more rally in early 2010 and then start a strong leg down likely gunning for parity again.
NZD/USD
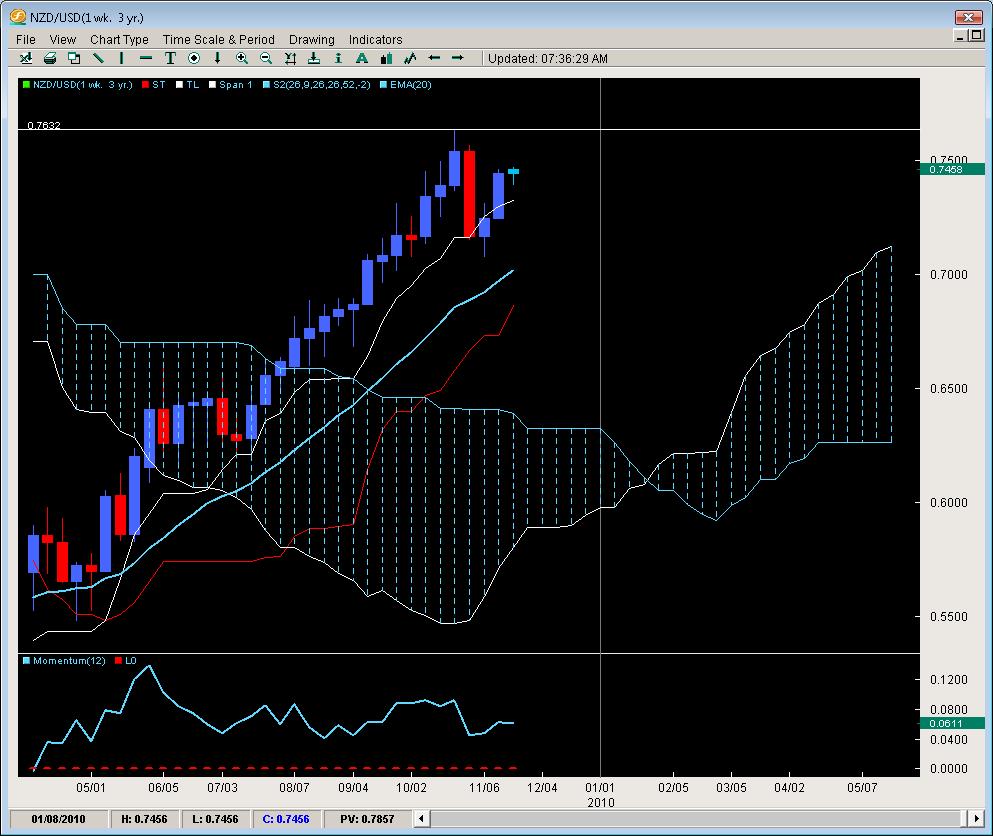
Wanting to make up for the losses from 3 weeks ago, its making a strong case to let traders know the trend is not over. Posting two strong weeks of buying, the pair showed its first real signs of weakness by closing below a rising Tenkan and it acting as resistance for rice. Luckily the pair opened last week and simply climbed so this was a short term good sign for bulls. However, the pair still has ground to make up and the yearly highs at .7632 will provide an interesting test. Any rejection there which has conviction to it will with high probability target the Tenkan. If this is followed by a 2nd week of selling (something not seen since June 09′) then the 20ema will likely be the next downside target. We feel at current price there is an inherent risk issue of buying so but a daily TKx signals is forming which is common to see before a major resistance level is broken. Cautious buying at best until break and close above yearly highs.
Chris Capre is the current Fund Manager for White Knight Investments (www.whiteknightfxi.com/index.html). He specializes in the technical aspects of trading particularly using Ichimoku, Momentum, Bollinger Band, Pivot and Price Action models to trade the markets. He is considered to be at the cutting edge of Technical Analysis and is well regarded for his Ichimoku Analysis, along with building trading systems and Risk Reduction in trading applications. For more information about his services or his company, visit www.2ndskies.com.
