Capre’s Forex Analysis
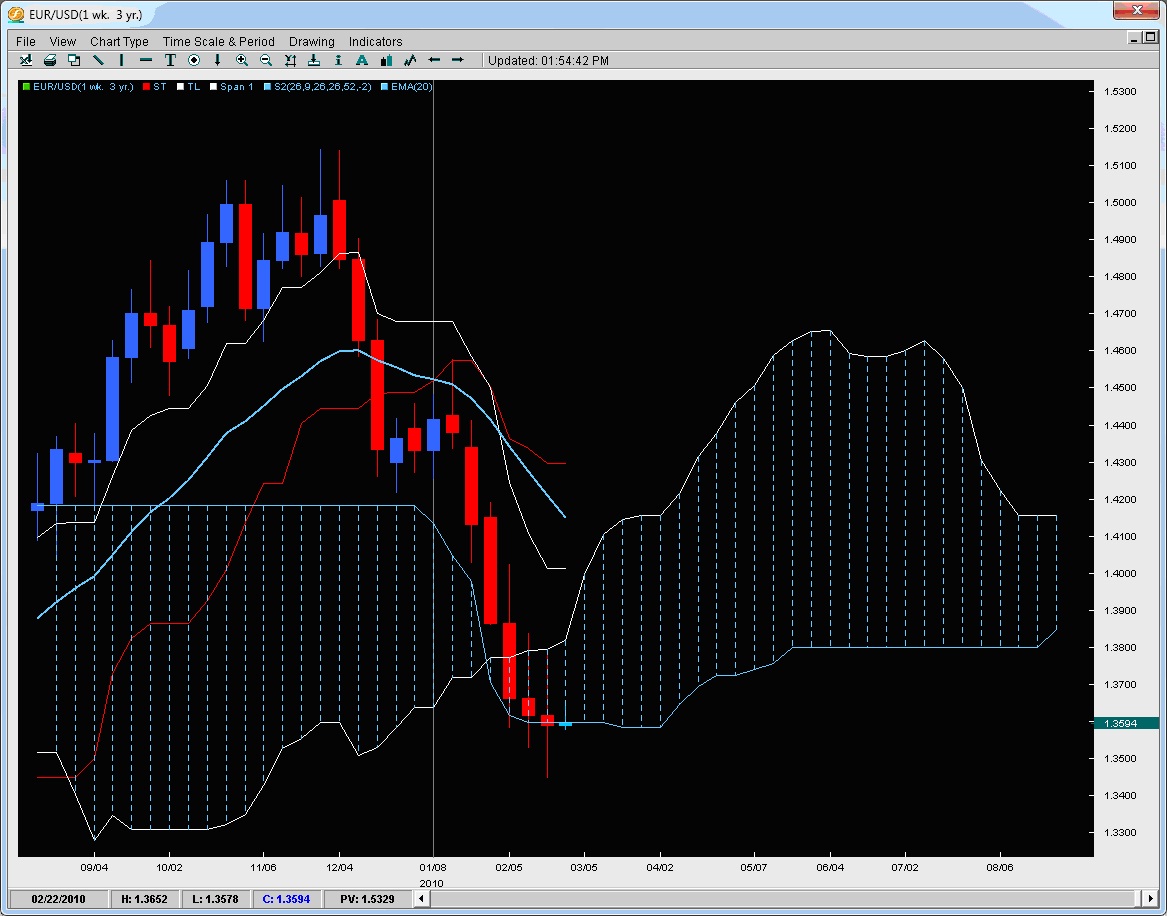
EUR/USD – 3 Attempts and 3 failures
Tis now the third time the pair has tried to close below the Kumo bottom and third time it has failed producing a relative doji in last weeks price action. The pair tried to push up then down and went virtually nowhere. The market definitely digested the rate hike from the Fed but it seems like the pair is either consolidating its losses before another run or its really attempting to see if the bulls have the real strength to take the mantle.
For now, its under review with the overall downward structure unchanged but no new added momentum so we cannot get excited about being overly bearish. A rejection upon the 10ema is a decent short term aggressive play but until we get a weekly close below the 1.3500 figure, we are cautiously bearish and waiting for some new talent to arrive.
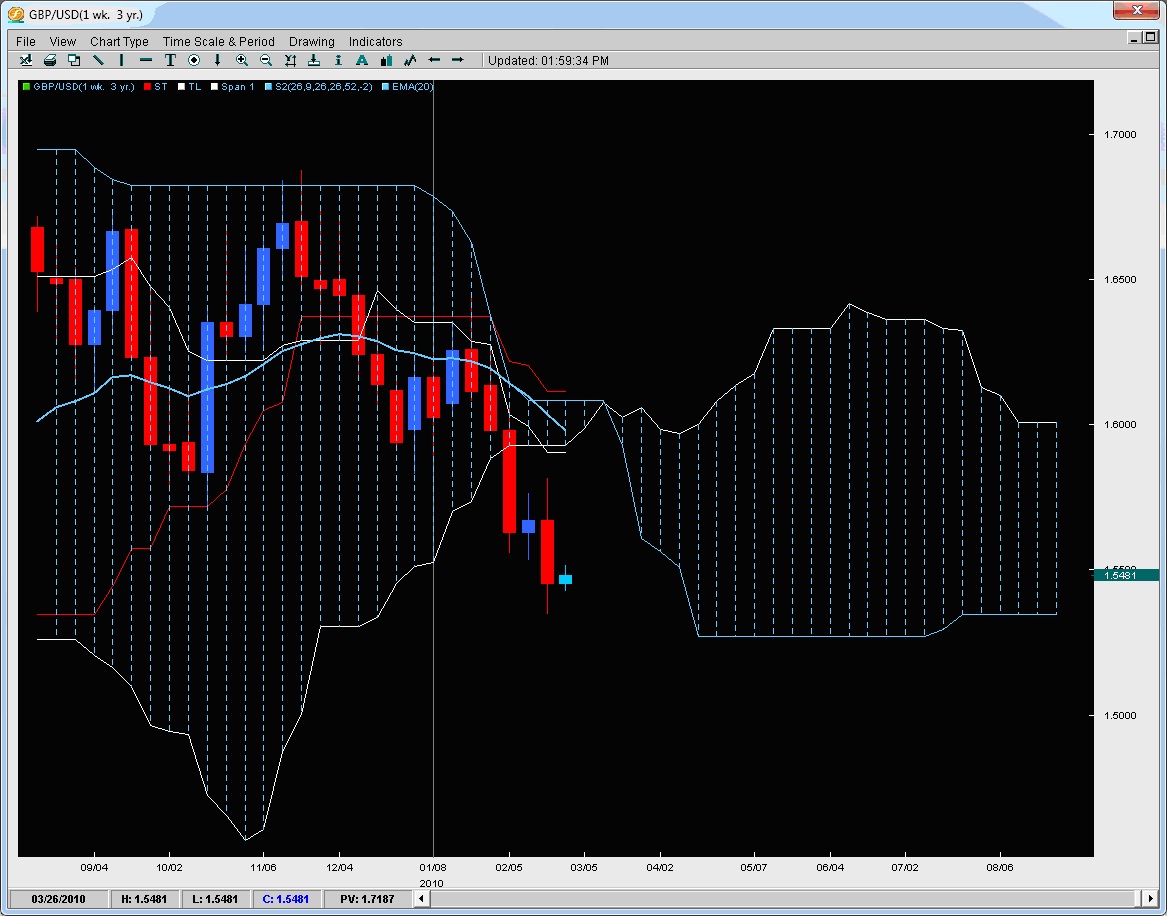
GBP/USD – Adding to the downside pressure
After holding in place and forming a relative inside bar, the pair sold off again closing just below the major intraday floor at 1.5550 which should act as a short term rejection area. If the last pattern holds, this week could trot in place but if the pair does not make it up above 1.6000 by late March, the falling Senkou Span B on the Kumo should exert downside pressure on the pair forcing lower ground. Should the pair close below last weeks low then a move towards 1.5000 seems in order. For now, momentum is slightly tilted down but nothing extravagant.
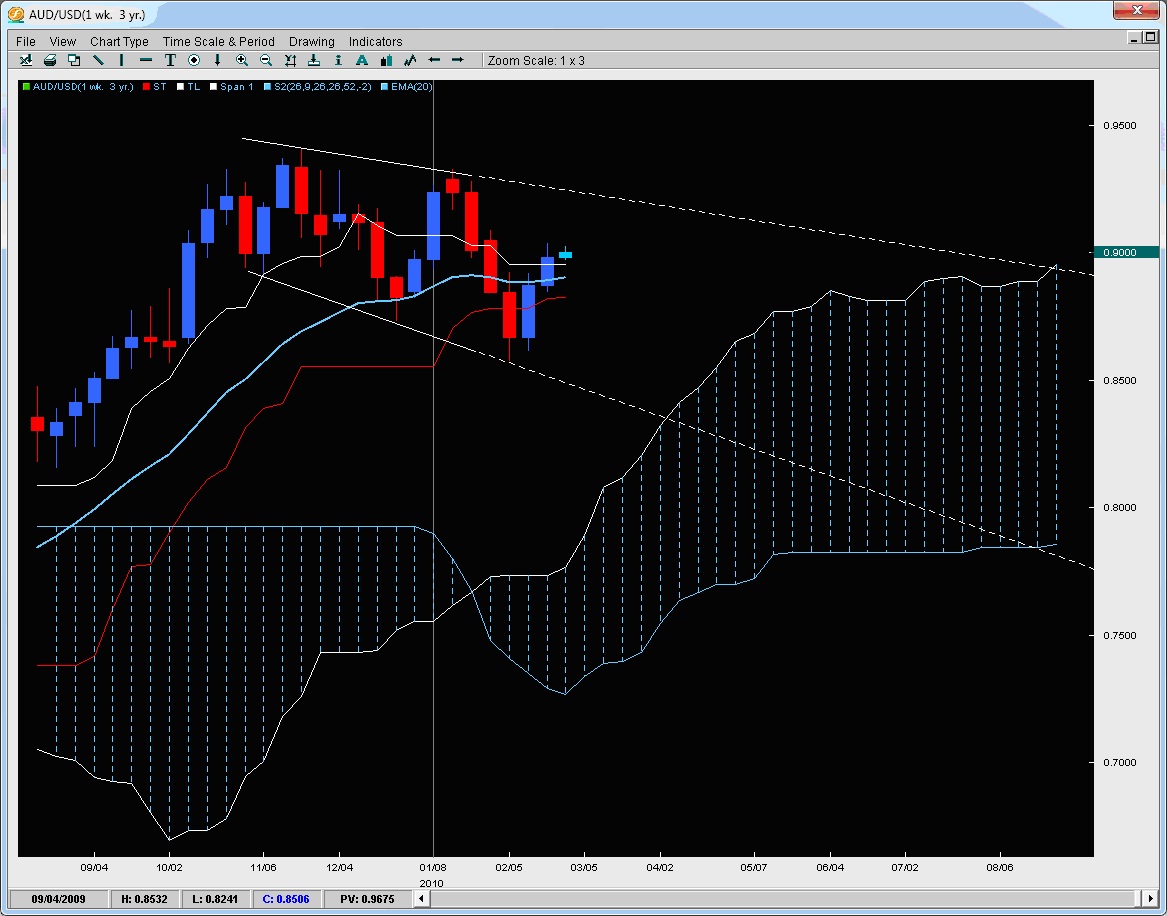
AUD/USD – Complex but wide channel with flat Momentum
There is not much about this picture which is pretty or consistent on either side. You have an expanding triangle which is a horrible pattern to trade, you have all three lines flat showing no momentum at all and lower lows which declined faster than the lower highs did so there is little consistency in the overall structure making only the wide levels worth playing. With that being said, there is the highs between 9400-9300 for shorts and the trendline bottom at .8700 for a potential buy. Declines are likely not to be heavy as the Kumo is thick, strong and building over time suggesting the breeze of the kumo should carry the pair up.
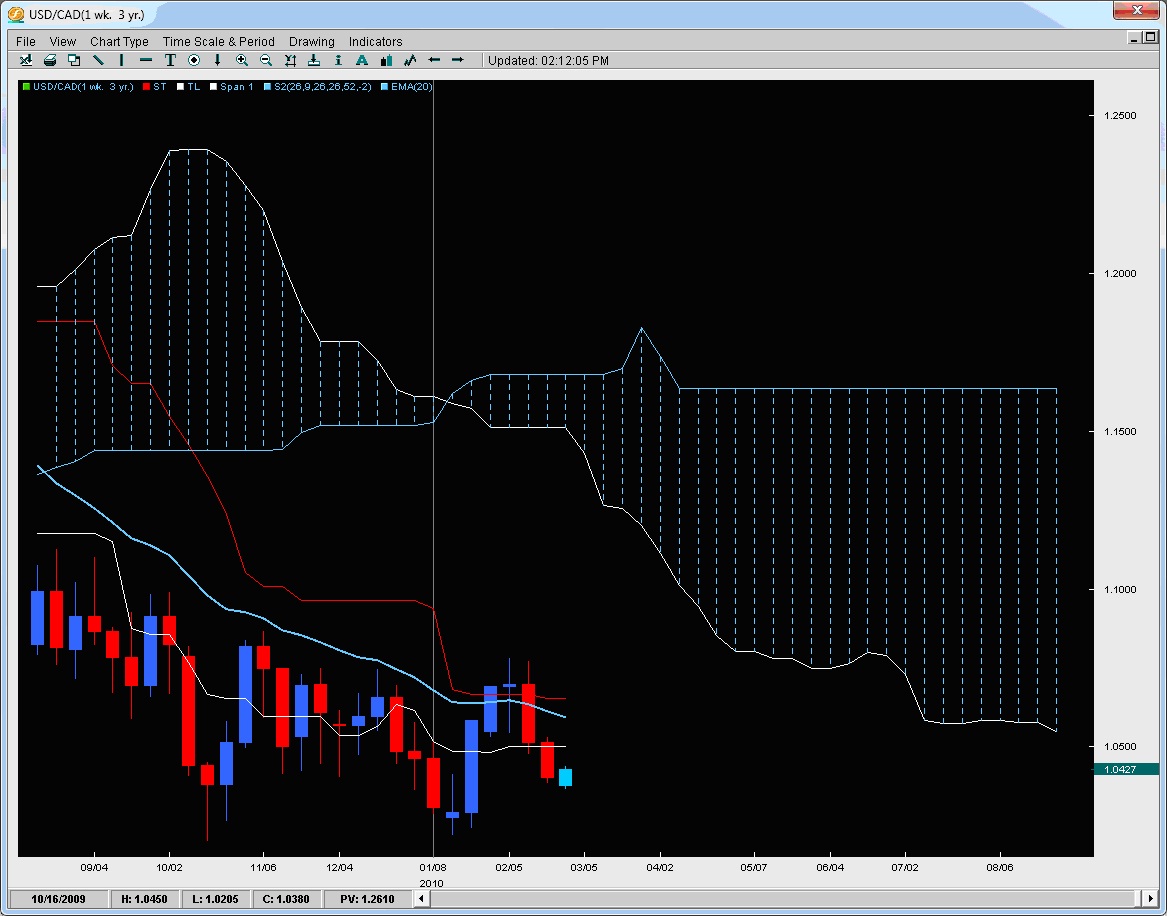
USD/CAD – Failed above the Kijun, looking for a bottom
After closing above the Kijun for the first time in a long time, the pair failed to gain any new buyers and ultimately slammed back down below it, the 20ema and the Tenkan in less than two weeks. It the pair wanted to be tidy, it would head for 1.0200 where other buyers would likely be excited to scoop up the pair. We feel if you want to be a bull, then wait for 1.0200 or uber-strong signs of a bottom forming before going long. For bears, the 20ema is the only thing offering a play for now currently clocking in at 1.0595 with stops just above the Kijun.
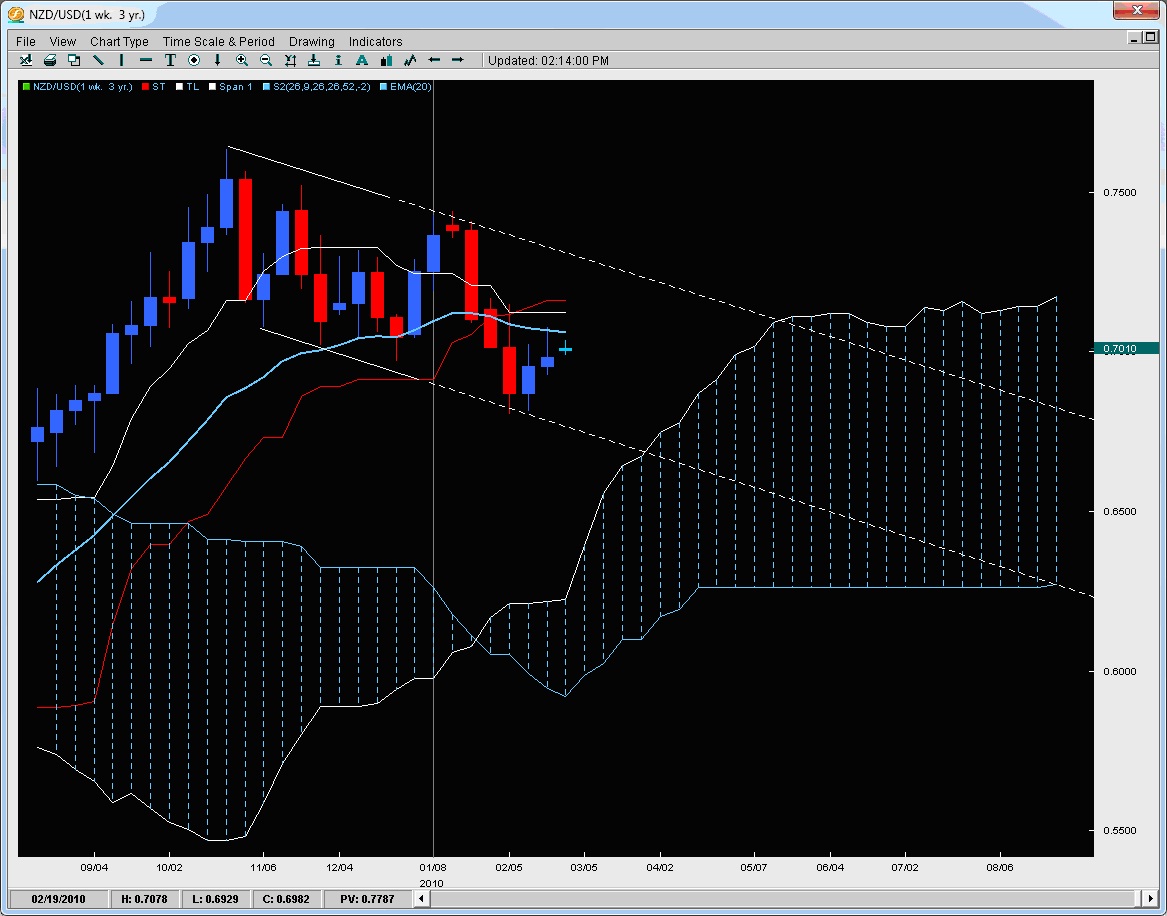
NZD/USD -Showing the weakest strength against the USD
Gaining for two weeks but failing at the 20ema, the pair looks like it will use all three lines above as a test of strength to qualify the bulls desire to take control or concede it again. The pair is in a channel which is relatively stable so we have wide lines and shorter term lines for plays on both sides as the channel top and bottom offer reversal plays while the 20ema, Tenkan and Kijun offer tests for the upside and possible rejection plays. Should the pair remain in the channel till the Kumo, then it will either use it as a base for another run up or likely slam through it and head for the flat bottom.
Chris Capre is the current Fund Manager for White Knight Investments (www.whiteknightfxi.com/index.html). He specializes in the technical aspects of trading particularly using Ichimoku, Momentum, Bollinger Band, Pivot and Price Action models to trade the markets. He is considered to be at the cutting edge of Technical Analysis and is well regarded for his Ichimoku Analysis, along with building trading systems and Risk Reduction in trading applications. For more information about his services or his company, visit www.2ndskies.com.
