Capre’s Weekly Forex Report
EUR/USD
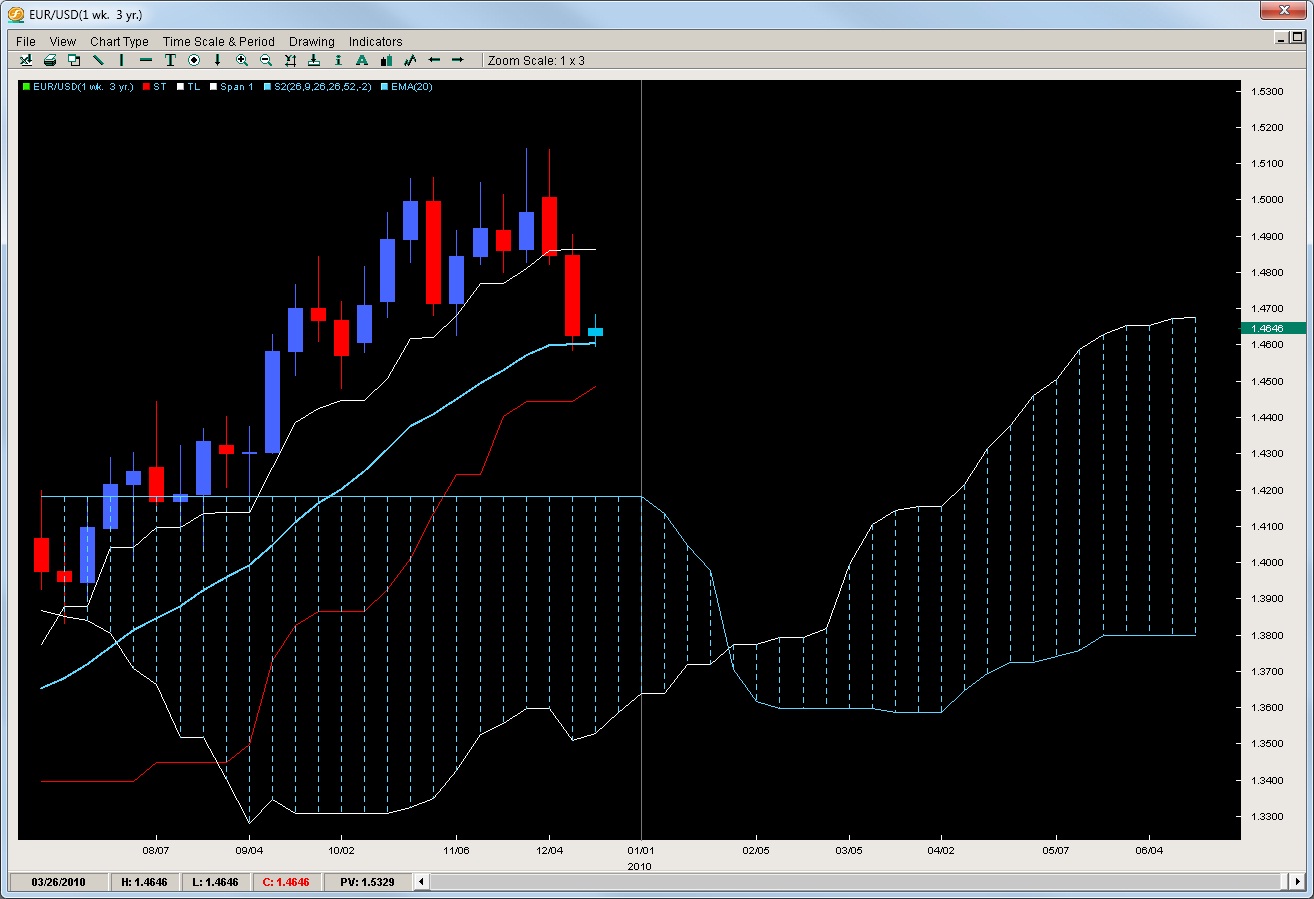
As we had talked about last week, we expected the EUR/USD to fall and the most likely target would be the 20ema. That is exactly what happened as it touched it and closed just above it. What now is in store for the pair. We definitely feel with the lower liquidity the ceiling for the pair is likely going to be the weekly tenkan. Movements are getting small and almost not even worth looking at on any intraday time frame below 4hr charts. Thus, if you are looking to sell, we have our upside line. If the pair breaks the 20ema by more than 60pips, we feel the next downside target is the Kijun. The challenge here lies in the fact the Kijun is only 160pips from current price so not too much room to work with once the break is qualified. Our favored plays are moves up to the Tenkan or daily closes below the Kijun. If the latter scenario happens, you could play a retest of the Kijun or trade the break which carries more risk. Daily closes below the Kumo likely target the flat Kumo top which sits currently at 1.4184 so there is plenty of downside play.
GBP/USD
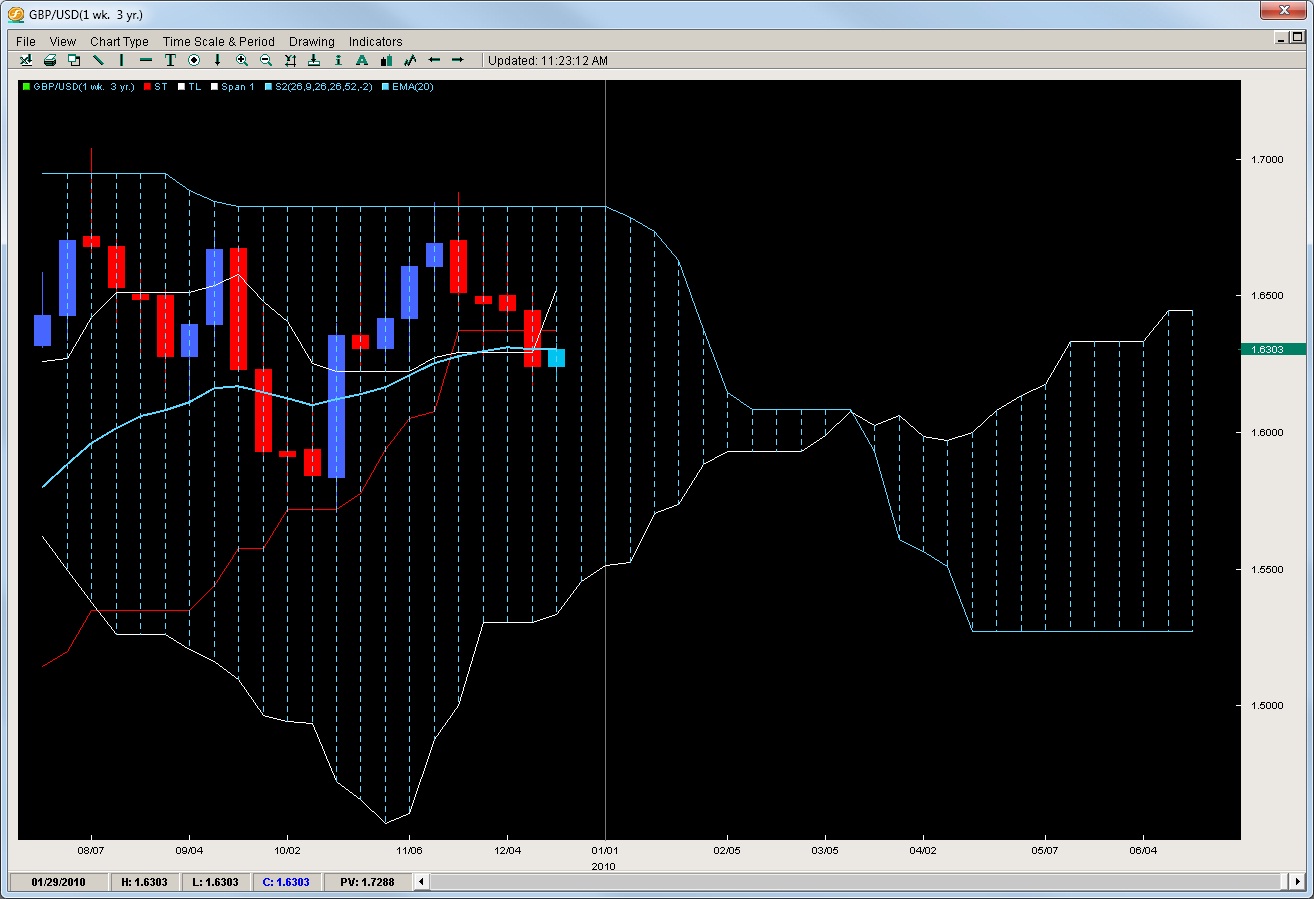
Closing below the three amigos (tenkan, kijun, and 20ema) caused a lot of additional selling as the pair had one of its biggest selling weeks since September this year. Now that the pair has broken the three lines, upside rallies offer potential selling opportunities. Locations to sell would be 1.6445 which is last weeks open. Just below that is the Kijun which clocks in at 1.6375. Overall, we like selling at the higher level but it should be noted the pair has sold off for four consecutive weeks and it has yet to do 5 weeks in a row this entire year so we may see some profit taking meaning this week could be a pullback week. If price action gets aggressive to the downside and clears 1.6100 then we expect a move down to 1.5700 by the end of this year or 1st/2nd week in 2010.
AUD/USD
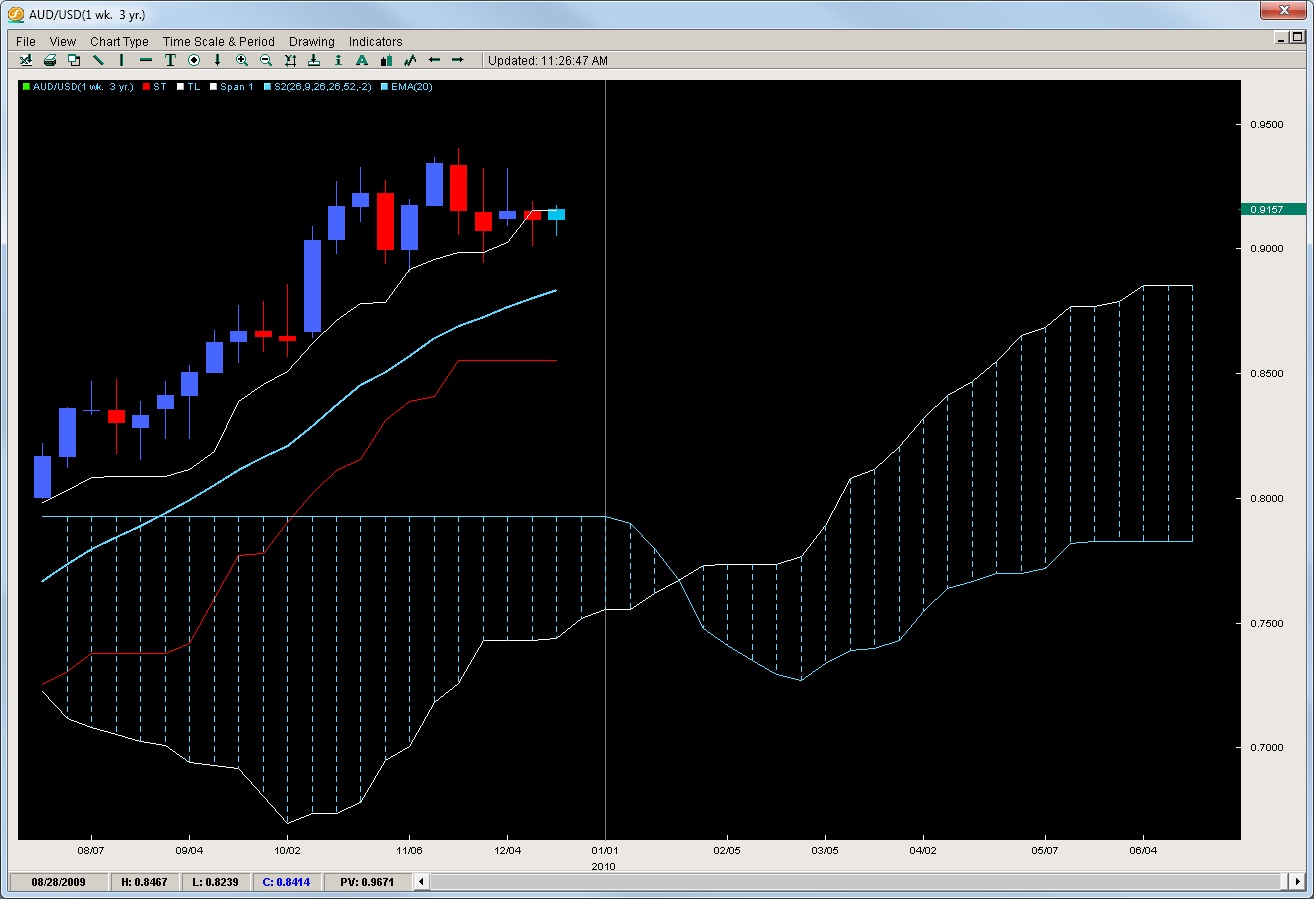
Trotting in place like a show pony, the pair has pretty much opened and closed between 9150 and 9075 for the last 4 weeks. Nothing to write home to momma about. It has posted its 1st close below the Tenkan but yet has produced two wicks to the downside over the last two weeks with each one producing higher lows suggesting its attempting another leg up. Honestly, we feel the market just does not have enough steam in its stride to make such a move and we feel any up moves will likely falter ahead of 9321. Any aggressive daily closes below 9000 should target the 20ema currently at 8833.
USD/CAD
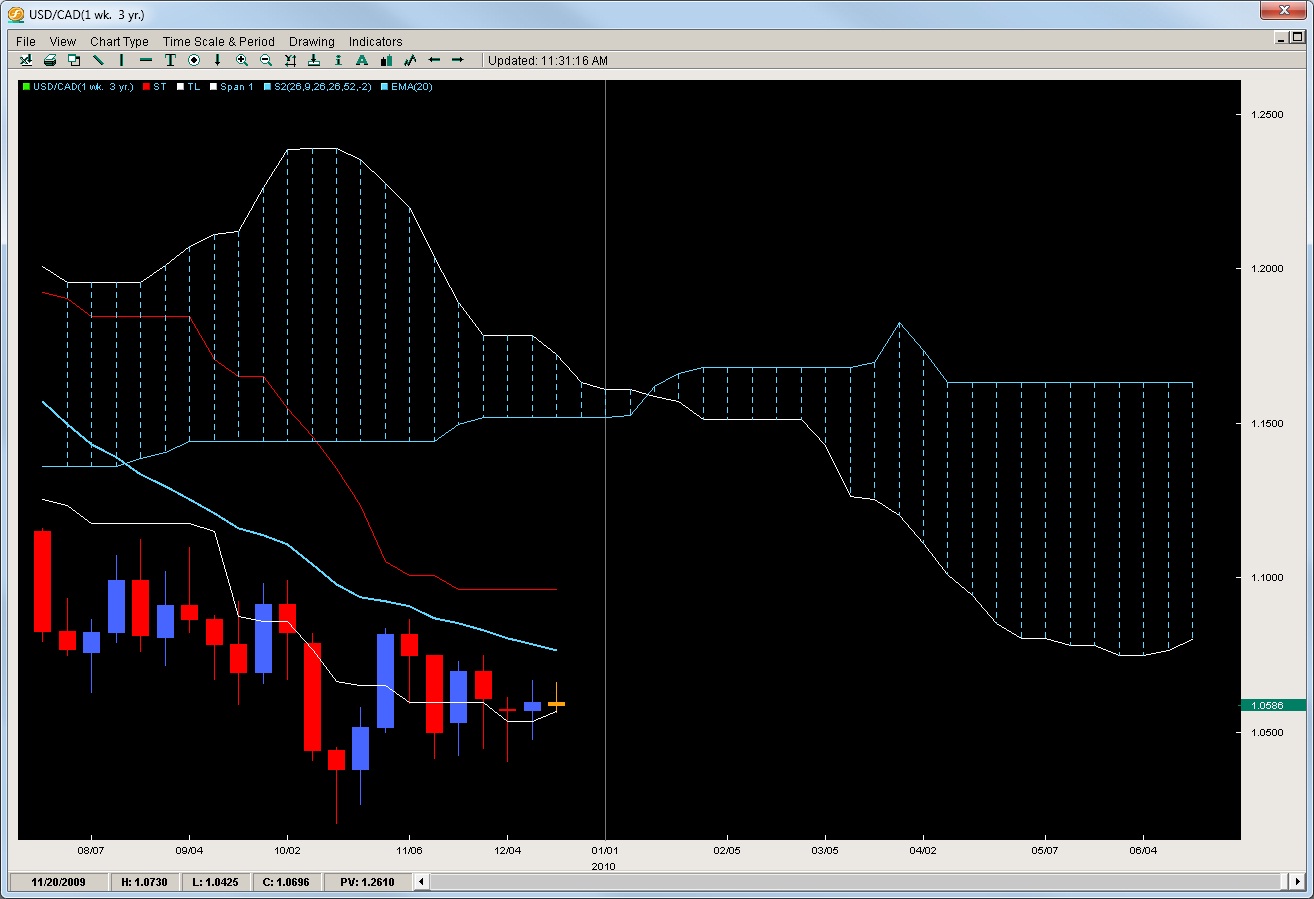
Not much to report on the Loonie front as the pair is being cradled by the Tenkan but is like the Aussie with closes and opens on a weekly basis relatively where they started and less than 50pips apart making trading frustrating if your looking for some final plays of the year. If you are more attracted to selling the pair, we suggest waiting for a short rally to the 20ema at 1.0766 and if you are looking to buy, then the price base formed around 1.0400 should offer some good support as rejections down there have been consistent. Current Kumo structure suggests a rally may be in order for the next two months but downside is likely to continue if we do not see a Kumo break by mid March 2010.
NZD/USD
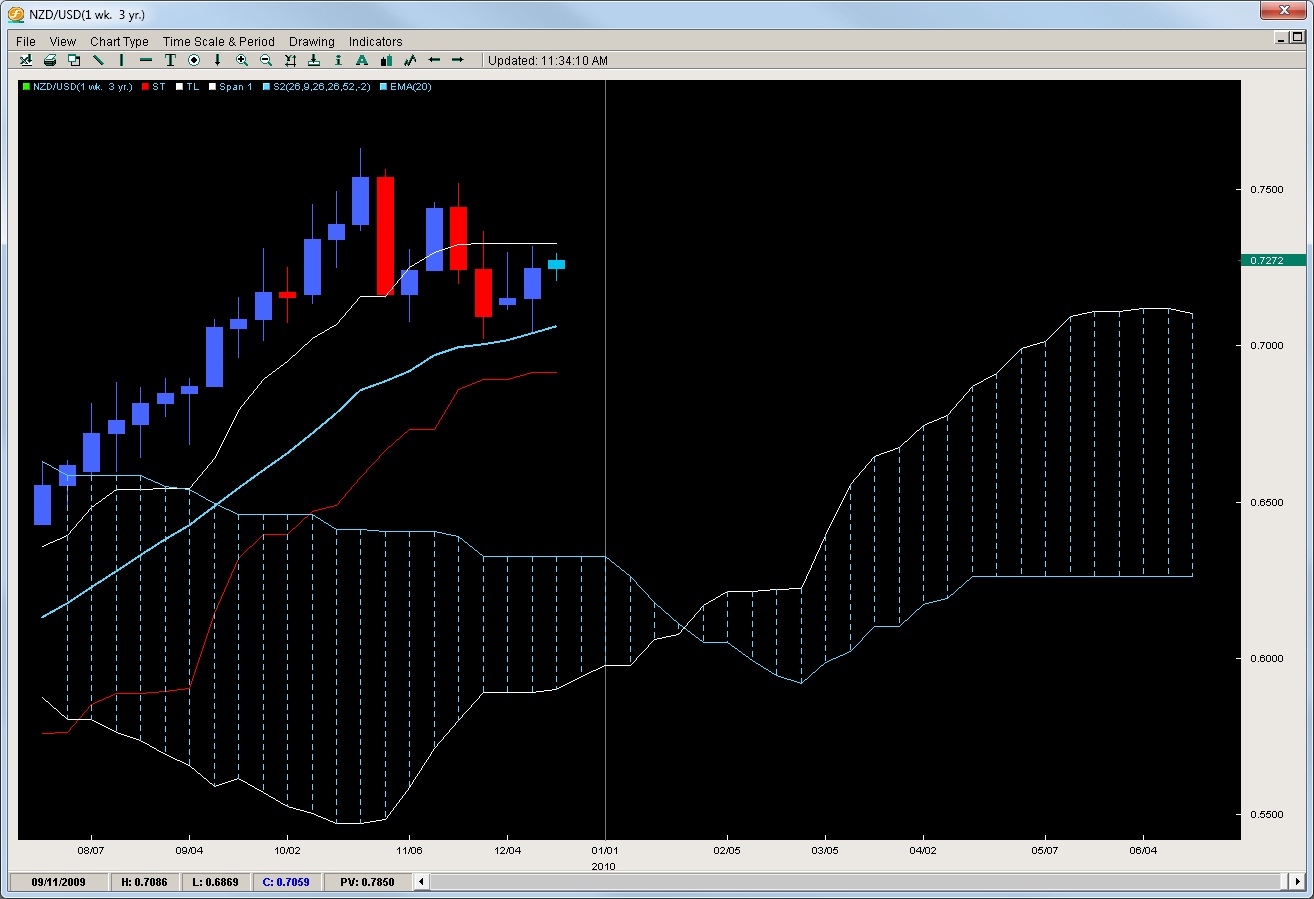
One of the more interesting pairs to trade, the kiwi has offered a clear buy level at the weekly 20ema which has held two rejections with each one coming within 20pips of the Tenkan offering about 280 pips of play room. The last two candles holding off the 20ema with the strong bounce and closing higher suggest the pair really wants to break above the Tenkan and get another crack at 7500. If it should break the white line, we feel 7445 is a likely upside target. Bears can take a slightly aggressive play by shorting off the Tenkan or on a daily close below the 20ema for a play to the Kijun at 6915.
Chris Capre is the current Fund Manager for White Knight Investments (www.whiteknightfxi.com/index.html). He specializes in the technical aspects of trading particularly using Ichimoku, Momentum, Bollinger Band, Pivot and Price Action models to trade the markets. He is considered to be at the cutting edge of Technical Analysis and is well regarded for his Ichimoku Analysis, along with building trading systems and Risk Reduction in trading applications. For more information about his services or his company, visit www.2ndskies.com.
