Capre’s Weekly Forex Report
EUR/USD
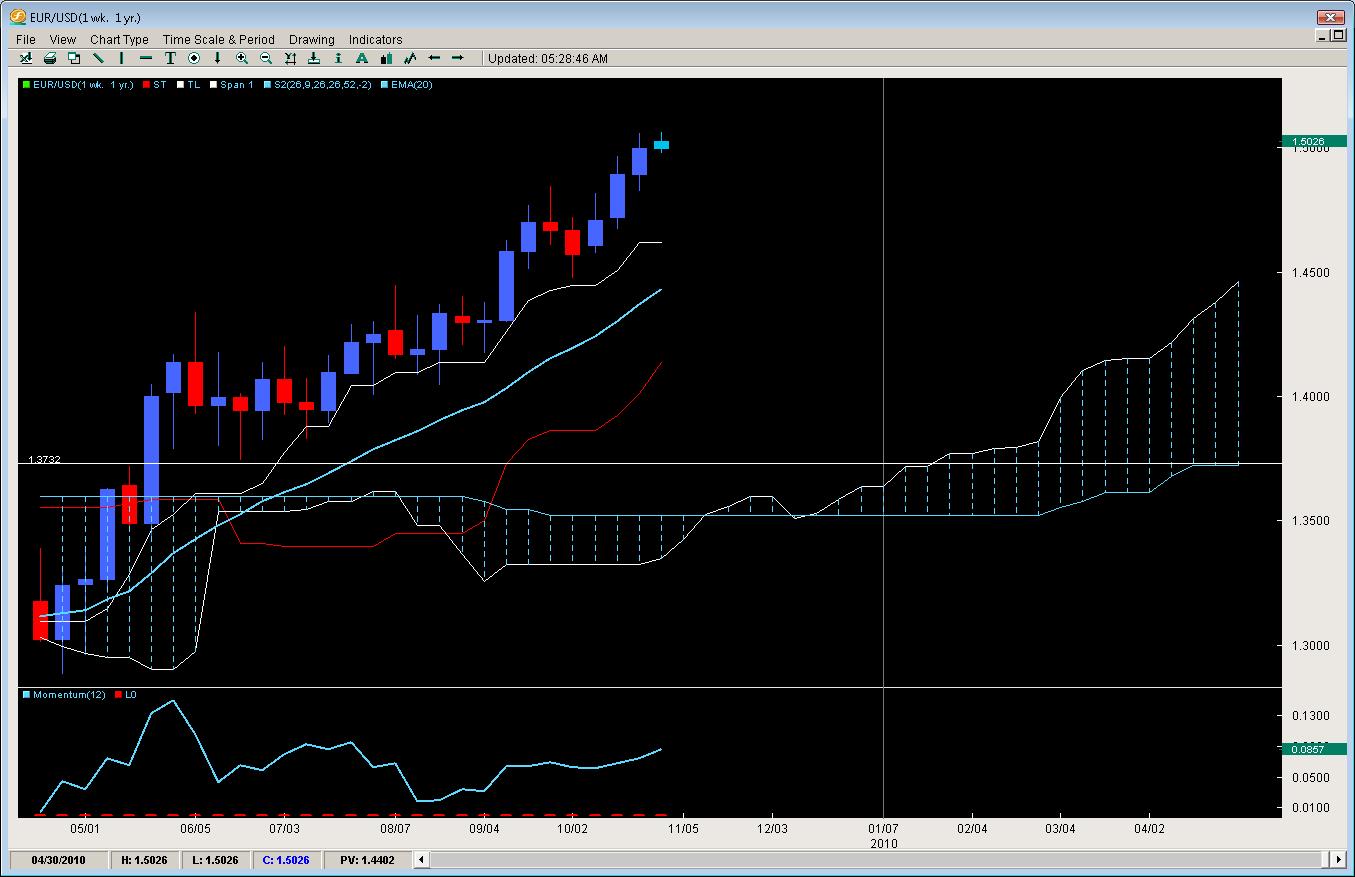
Since its weekly close above the 20ema in early May 09′ and the Kumo break later that month, the pair has yet to post two weekly closes back to back. In fact, out of 28 weeks, the pair has only closed down 10 posting a 65% weekly up close for the last 6months. Currently its riding a 3 week wave of higher closes and our analysis points to a higher close.
The pair is showing more comfort everyday above the 1.5000 handle which is very different than when it attempted to wear the clothes of 1.60 more comfortable only lasting a day above and then getting slammed the following. We feel the more time above 1.5000, the more the market will realize its ok there and will start to make a base there for a launch higher.
Kumo analysis says unless there is an apocalyptic drop from here, the base above 1.36 and 1.40 is in place and the pair will likely use any dips there to launch another attack on 1.50 and 1.60. The three amigos (Tenkan/20ema /Kijun) are all in order and pretty much climbing so should support on any dips. Price has not closed below the Tenkan since late April and has used it as a springboard for more buying and higher prices. A break here may make the bulls question their long positions but a 20ema would be more convincing and possibly create a technical event to sell. However, we feel this is unlikely and people will overall want to be buying Euros of Greenbacks.
GBP/USD
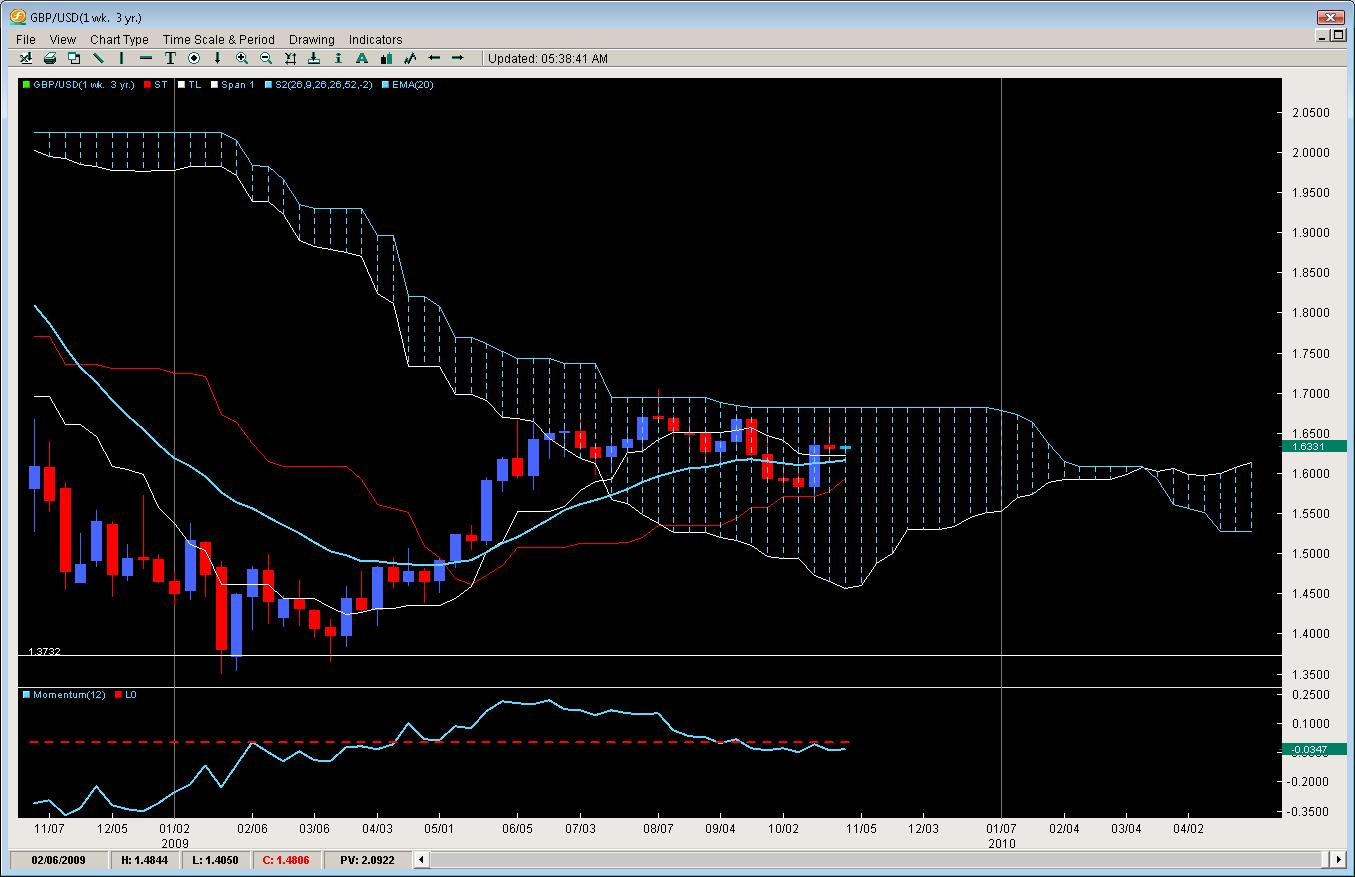
Starting off last week like a champ, the pair was threatening to close above the 1.6650 area and gain 300pips on the week which would have been impressive. However the pair had to take some bad news on the chin and in the gut when GDP was announced as a contraction with 30+bloomberg analysts all calling for a .2% increase. Traders dumped pounds by the kilos as the pair reacted as badly to the news as someone getting bitten by a Black Mamba snake while opening a letter from the IRS saying their being audited – in other words, the pair suffered badly. Dropping almost 2cents in a matter of an hour, the pair ended the week closing down instead of up and all the efforts by the bulls were annihilated.
We think this will create either two likely scenarios;
A) traders will have digested the news and overall feel better about being long the GBP than the USD
or
B) the stink from the dreaded GDP numbers will be too much to not notice in the room and traders will not be really interested in being long GBP so may pile into EUR/GBP longs or just sell GBP’s as a whole. We are more in the latter camp if the pair does not come out of the gate this week with a stiff jab, strong right cross followed by an uppercut that lands on the chin.
Technically the pair does have some strong support (not from price) but more so from the 20ema and the Tenkan which are flat and below. This could be a technical reason for traders to get long and would be a good pricing with the Kijun climbing wanting to come to the party. Any close below the 20ema will likely erode the confidence of bulls and likely see a fair amount of longs exit sending the pari back to 1.60 and below to test the support in the 1.58/59 region. Caution advised on building heavy longs.
AUD/USD
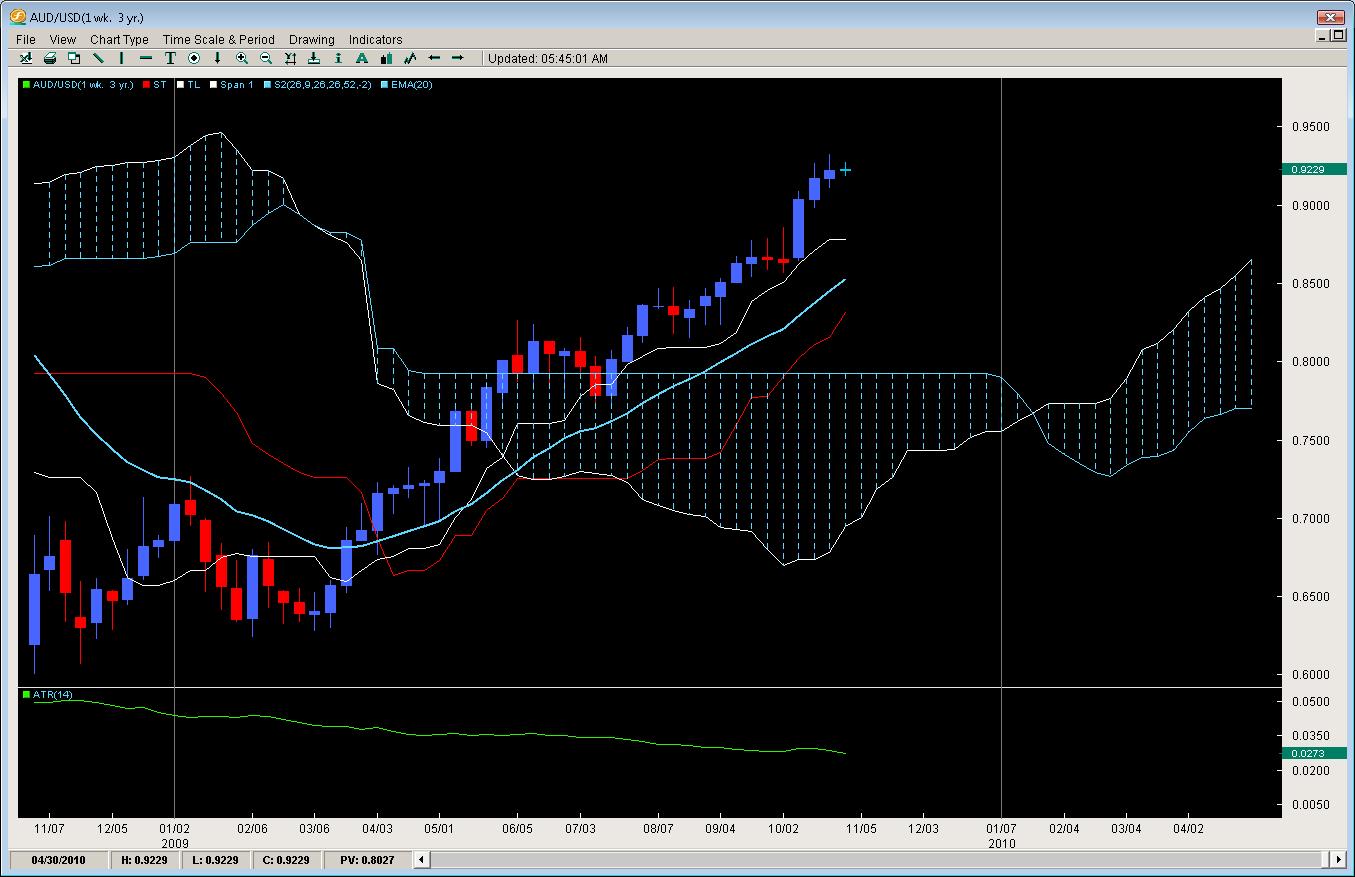
Still climbing, still gaining week after week, the pair continues to post gains albeit small ones. With only 4 out of the last 12 weekly gains only being at or outside the weekly ATR, it appears as if only heavy longs are being added when the pair finds itself near the weekly Tenkan or daily 20ema. Other than that, we feel its simply momentum, combined with the fact nobody really wants to be long USD vs. AUD and that AUD is likely in an increasing rate cycle the pair is marching on. We feel the march will go on but that 95 or perhaps parity could be what Russia was to Napoleon – too far an advance without the supplies to support the troop effort.
Based on the pattern, we prefer only buying on a dip early in the week or after a weekly close down (as long as its not drastic or outside the weekly ATR). The pair has shown an affinity to dip each week only to end up closing higher with only 7 weekly closes down since breaking above the kumo while only 5 out of 14 up closes did not have a dip at least 1/3 into the previous weekly range.
USD/CAD
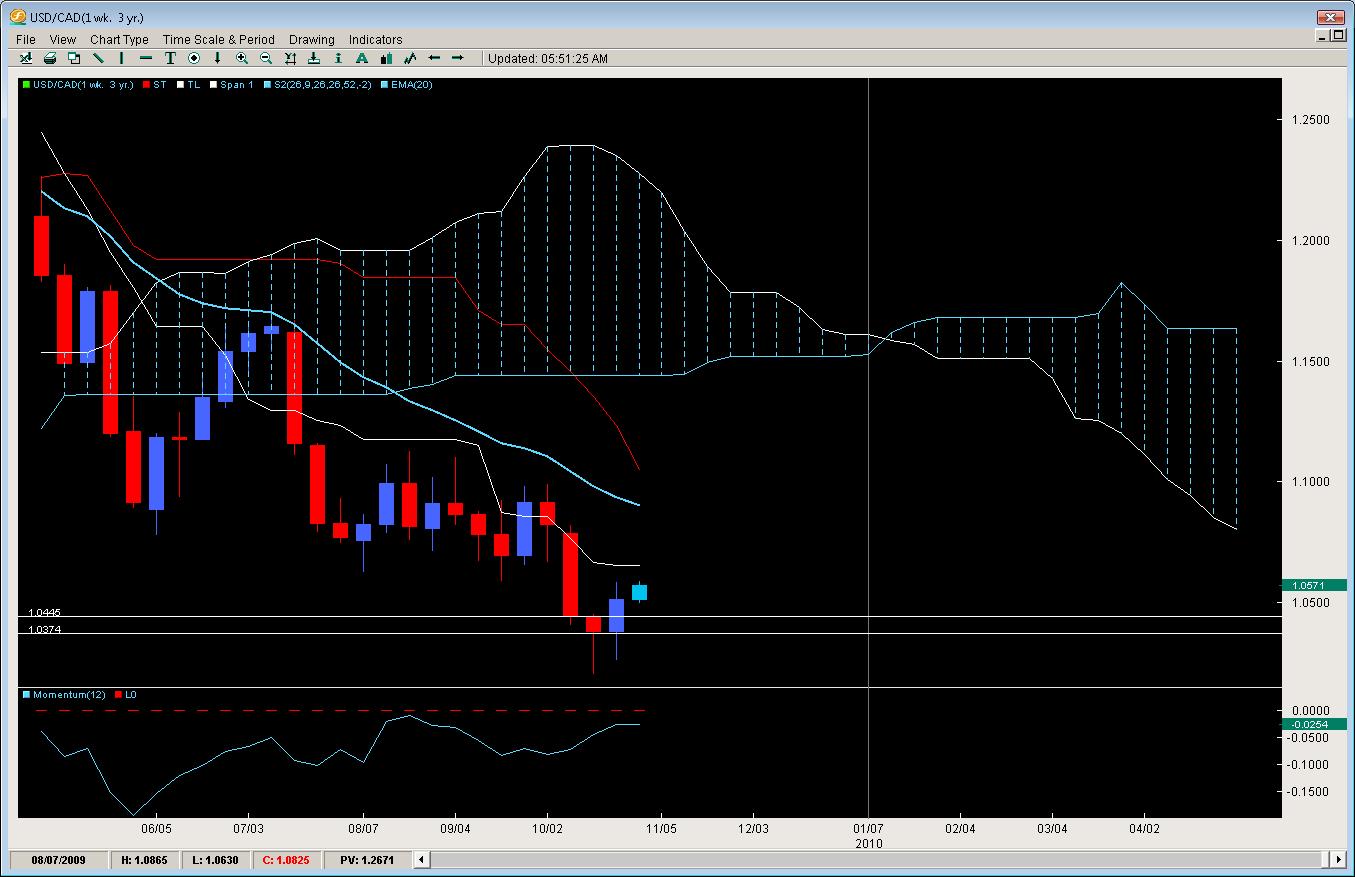
Posting its 1st weekly close outside of the previous weeks range for the first time in over two months, the pair looks set to test the weekly Tenkan where a close above will likely give it enough lift to attack the 20ema, something that has not been touched since the beginning of July. All three amigos (Tenkan/20ema/Kijun) which will make any upside surges pass some tests before convincing traders the pair is going long. Overall though the short term lift off the lows this year appear to be for real as we have good momentum divergence coming into the bounce. Another weekly close up, especially outside of the previous weeks range would suggest the bounce is for real and the 20ema is next up to bat for the longer term bears.
Anyone wanting to go long could trade a break outside last weeks high or take a 61.8% dip of the previous weekly range which is right about the open for the last week.
NZD/USD
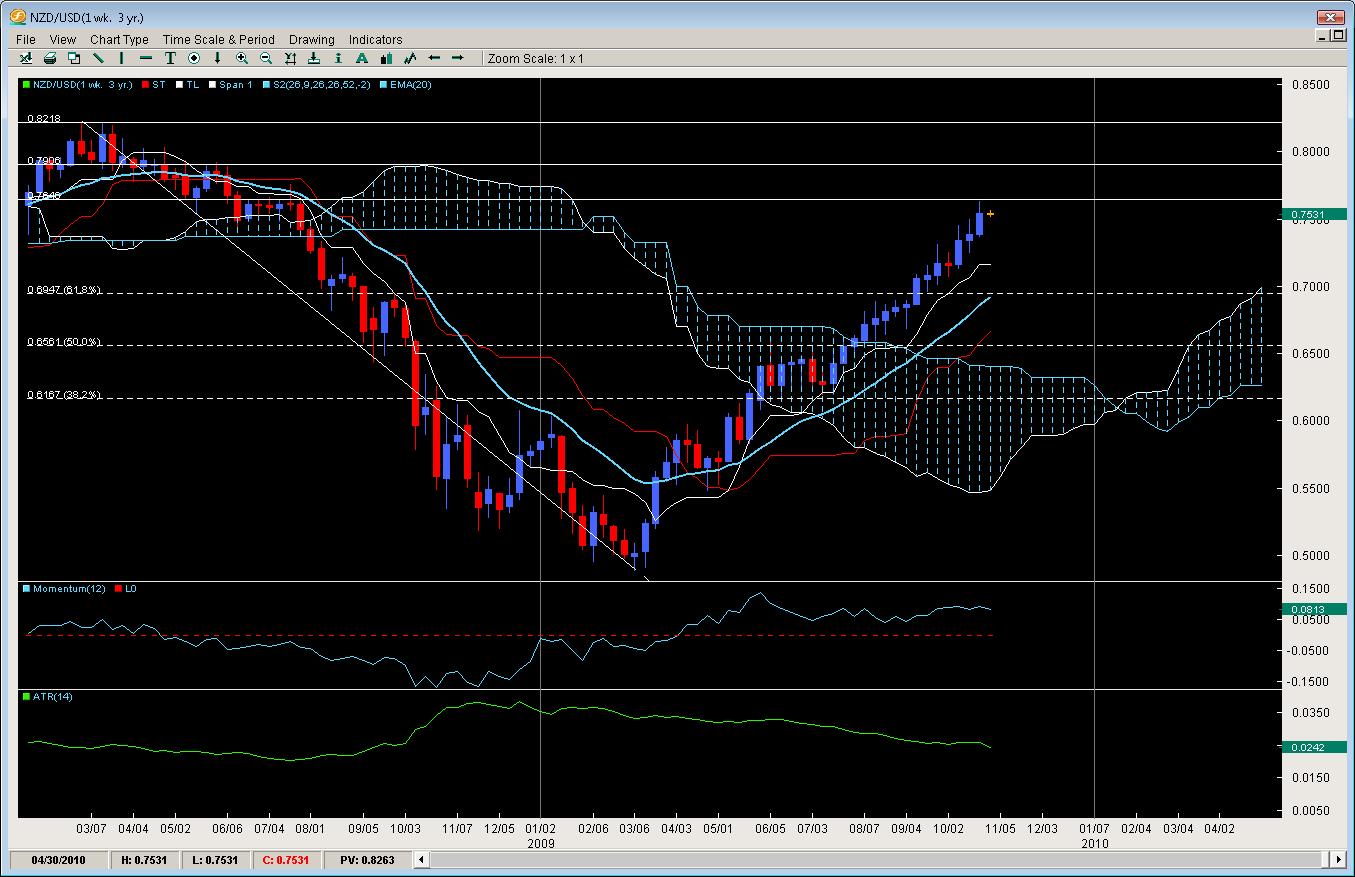
Under appreciated by the news and analysts across the board, the Kiwi has been more stable against the greenback than any other pair out there, even the more popular AUD with its fancy rate increase. Still only having 1 weekly close down since the Kumo break, the pair is posting smaller retracements and larger gains in relationship to the ATR than its big brother AUD.
The pair breezed through the 61.8% & 78.6% fibs of the 2008 drop and momentum is still hanging around the upper regions so we feel the pair will likely gain this week. Upper resistance levels to watch are last weeks high around .7645 and .7900. After that, we feel .8000 will be under serious threat if the garrison of spears and shields waiting for them there are breached. Beyond that, there is not much left except the 2008 highs just above .8200 so bears are running out of real-estate to hold their ground.
Chris Capre is the current Fund Manager for White Knight Investments (www.whiteknightfxi.com/index.html). He specializes in the technical aspects of trading particularly using Ichimoku, Momentum, Bollinger Band, Pivot and Price Action models to trade the markets. He is considered to be at the cutting edge of Technical Analysis and is well regarded for his Ichimoku Analysis, along with building trading systems and Risk Reduction in trading applications. For more information about his services or his company, visit www.2ndskies.com.
