Characteristics Traders Should Look For In Double-Bottom Bases
One trick to buying off
correction-recovery patterns is spotting the point where new buyers have
overcome the so-called weak holders. Long, flat bases wear out the weak holders.
Cup-with-handle bases scare and wear them out. Double-bottom bases lull the weak
holders into optimism, then take them out and shoot them.
Traders also call this formation the “W” pattern because the price traces something
resembling the letter. This is a bullish pattern, although it’s more failure
prone and occurs less frequently than, say, the cup-with-handle, the best known of
the correction-recovery patterns.
You can use double-bottom
bases to time buys in stocks or exchange-traded
funds. Broad markets also trace double-bottom patterns, making the W useful for general market timing.
In a classic
double-bottom pattern, a
stock will enter a correction and then start to rally off the correction low. At
this stage, shareholders who bought at higher price levels or foolishly “caught
the falling knife” (bought the stock on the decline) are patting themselves on
the back.Â
But the stock never
recovers its pre-correction high. Instead, the rally stalls below the high,
forming an intermediate peak. The share price falls again. The
shorts often smell blood at this juncture and pile on, accelerating the decline.
The bulls’ nerves are
fraying. Then the stock undercuts the prior low. This violation of presumed support panics the weak holders. They run for exits. Bullish new buyers spot a chance to profit from the fire sale and swoop in. The stock rebounds from its new low. Aided by the washout of weak holders, the stock’s shareholder base has shifted in favor of the bulls, obliging successive buyers to bid up the price in order to entice sellers to market.
Depending on the pattern,
the momentum trader can get up to two pivot points. The first occurs when the
stock surpasses the intermediate-term peak. Sometimes the stock will form a handle just below the intermediate-term peak before breaking out. Other times, it will head straight through the intermediate peak.
The second occurs if the
base forms a handle above the stock’s mid level
and its 50-day moving average and preferably its 200-day moving average. The mid
level is the price at which a stock has made up half of the maximum point loss
of the correction. To find the mid level, add the pre-correction intraday high
to the lowest low of the correction, then divide that sum by two.
The double-bottom handle
should have the same characteristics as the handle on a cup-with-handle pattern.
The price structure should drift downward as price volatility and trading volume
contract. The pivot is the high of the handle.
In each case, you buy as
the share price clears the pivot by 1/16 to 1/8 of a point on strong volume.
Assuming you’re an intermediate-term trader using a 5%-to-8% stop, don’t chase
stocks more than 5% beyond the pivot.Â
Amazon.com formed a
double-bottom base shortly after its May 1997 initial public offering. In fact,
this was the stock’s second-stage base from the IPO. Earlier bases tend to make
higher-probability trades than late-stage bases. The following chart uses
decimalized prices to adjust for multiple subsequent stock splits.
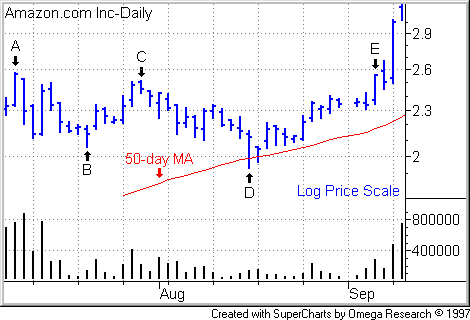
Shares in the Web-based
book and music retailer climbed to a high of 2.57 on July 10, 1997 (see Point
A on chart), then corrected to a July 22 low of 2.06 (Point
B). From there, the share price tried to recover but peaked at 2.51
on July 30 (Point C), then rolled over. On
this subsequent down leg, the stock put in a new low, making an intraday low of
1.94 on Aug. 15 (Point D).
As Amazon recovered, the
pattern trader would look to the July 30 intermediate peak as our pivot point.
Note that the intermediate peak of 2.51 sits nicely above Amazon’s mid level at 2.26 in
this case (high 2.57 + low 1.94, divided by 2). Nearing the pivot point, Amazon shares
put in a sideways price structure, serving as our handle, then cleared the pivot level on
a bullish increase in trading volume on Sept. 4 (Point
E).
Not all double-bottoms
form a pause or handle before breaking above their intermediate peaks. The
pause or handle should be of relatively brief duration. Very long handles are
failure prone.
Sometimes, a stock will
tear out of a double-bottom base without putting in a pivot. You can still buy,
but volume becomes even more critical. Buy only when volume appears
authoritative.
Of course, in all cases,
handle or no, set an initial protective stop capping your losses to an acceptable
level in the event your new buy turns against you.
Markets can undergo
double bottoms as well. You can either use this to buy securities that track
your market or simply as yet another confirmation technique to spot when a
tradable rally has begun.
When using this technique
for gauging overall markets, the issue of overhead supply is less of a factor.
You can throw out the requirement that the index overcome its mid level
before the buy. After all, you’re looking for a signal to help you enter early
into a fresh rally, not late.
The Nasdaq Composite
formed a double-bottom pattern in the second half of 1998. The first low
occurred on Sept. 1 at 1475.49 (Point A),
the intermediate peak on Sept. 28 (Point B),
the second low on Oct. 8 (Point C).
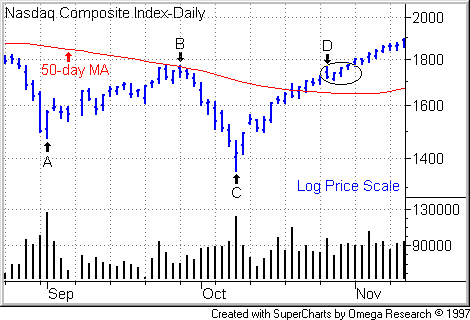
Notice how the index
bounced off the Oct. 8 low to close in the upper half of the session range on
huge volume, a classic reversal to the upside.
As I noted earlier, in a
proper double-bottom, an index or stock should not dither once it nears the
intermediate peak. The Naz encountered opposition at the intermediate peak on
Oct. 27 (Point D), then took out the
resistance a few days later.
For The Best Trading
Books, Video Courses and Software To Improve Your Trading