Chris Capre’s Forex Report: EUR/USD Likely to Retest the 10′ Lows
EUR/USD – A Retest of the 10′ Lows Likely
As we wrote last week:
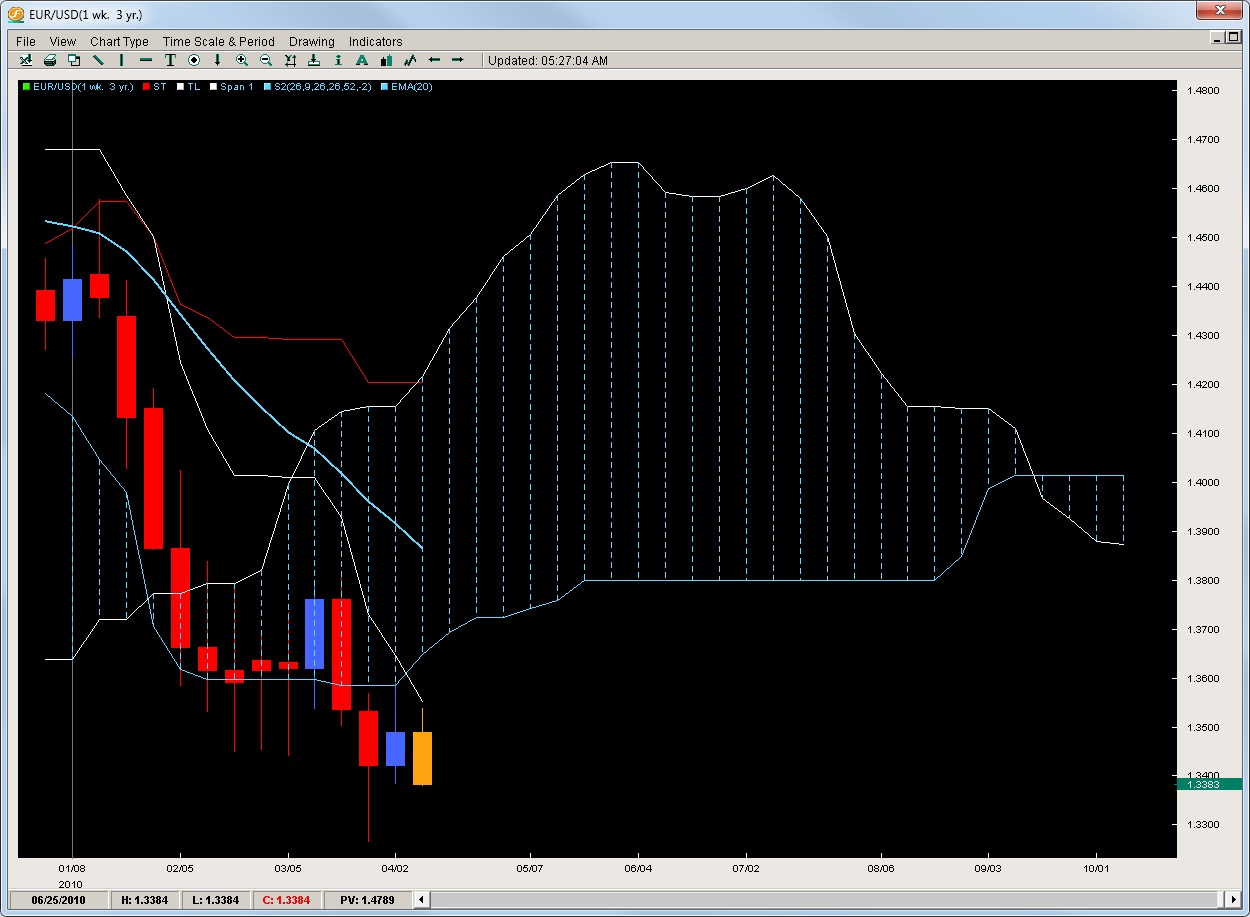
From an Ichimoku standpoint, the Tenkan is likely to limit upside gains and is currently posted just above the 61.8% rejection of the last downside swing from 1.3815 to 1.3421 so these levels should hold.
This is exactly what happened last week as the pair had a high of 1.3590 coming within a dozen or so pips from the Tenkan/ Kumo bottom and rejected at the end of the week while following it up this week with nothing but sales. The pair is now pressing against last weeks low and the Tenkan will likely again hold any upside rallies to the mid 1.3550’s for those looking to short on a rally. Now the pair looks set to challenge both the yearly lows at 1.3267 and should it break this level – the 1.3075 area before running into any buying pressure. We are looking for nothing but shorts at this point and feel the pair could be headed for some serious losses in the coming months.
GBP/USD – Back Down to the Yearly Lows?
As suggested last week:
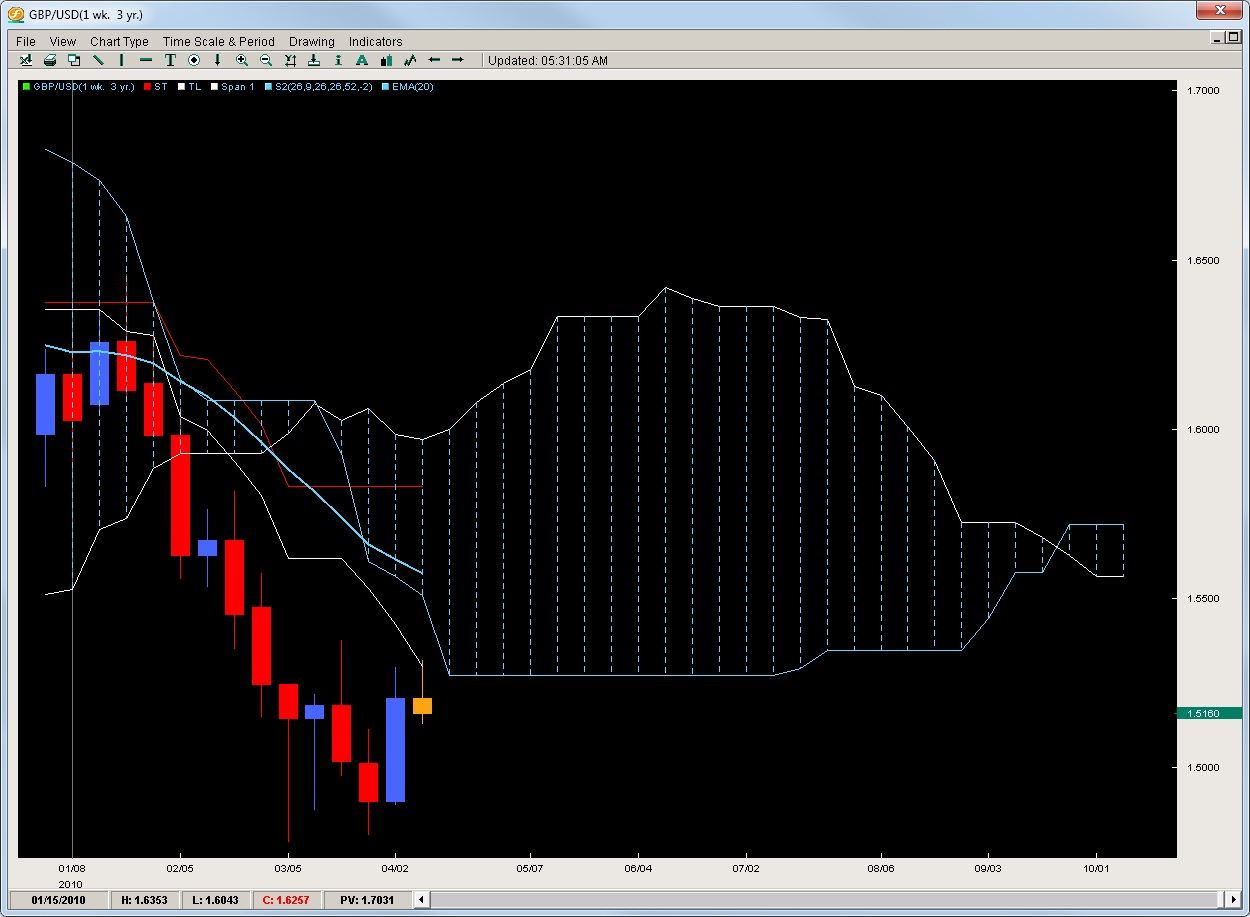
The good thing is if you want to be a bull, now is a good time as the pair is really close to the 10′ lows and gives traders a really nice risk to reward setup for going long.
The pair rallied last week off the yearly lows to bounce 400pips so hopefully the bulls got to make something off this move as we suggested. The pair has since rejected off the Tenkan just like the EUR/USD has and its possible the pair will make another run down to 1.5000 and the lows around 1.4800 where the bulls will undergo another stress test of their mettle. At this point, we feel bulls and bears will have to wait to take any decent positions since the prices are now off the highs and lows. With the range being so clearly outlined, we suggest only taking intraday plays with a greater favor towards the short side.
AUD/USD – Attempting to Break the Expanding Triangle
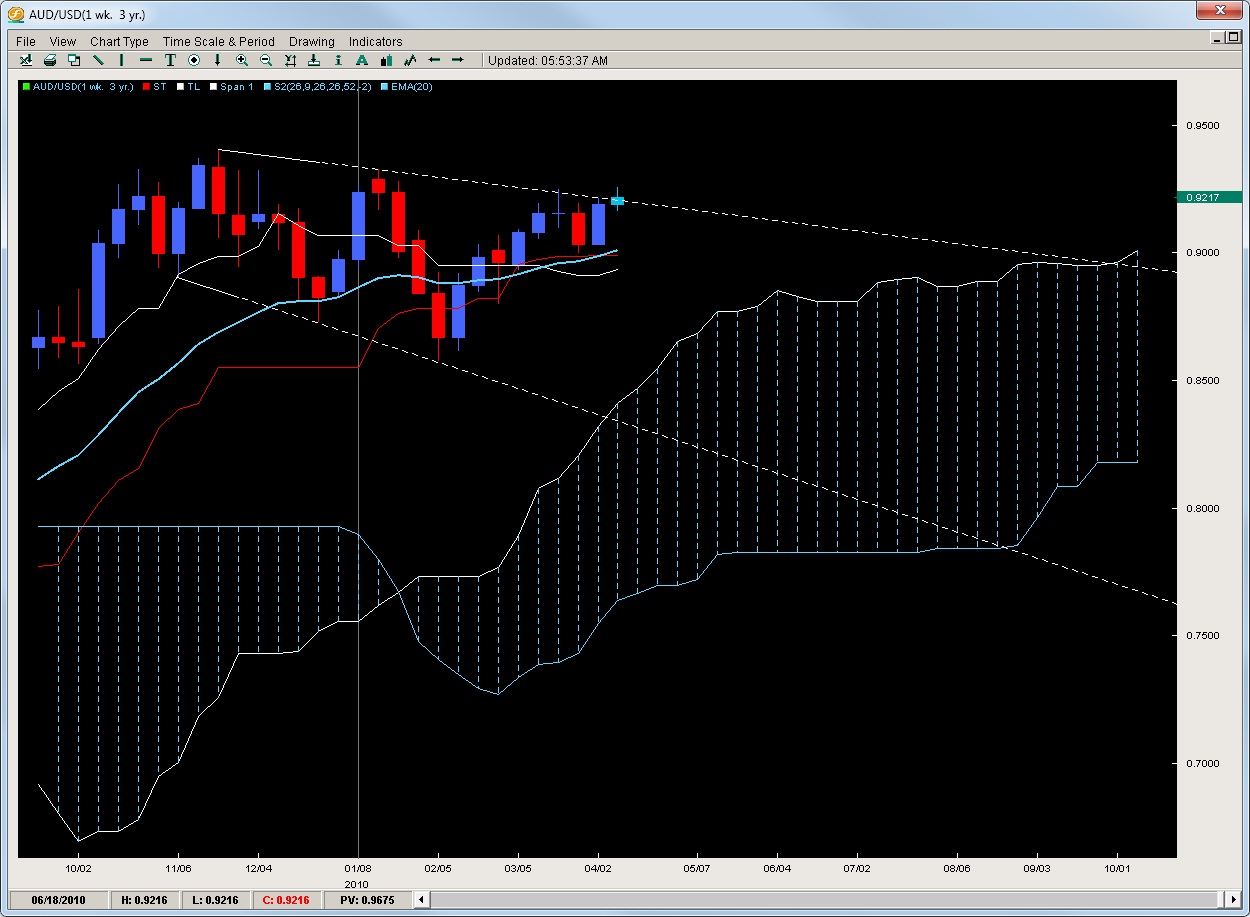
After being stuck within an expanding triangle for the last 5-months, the Aussie looks like its about to make a legitimate break of the pattern. After bouncing off the Tenkan 3-weeks ago, the pair is pressing heavily against the upper trendline for the pattern. It does have 2 other stops to clear beyond this line at the 10′ highs at .9327 and the 09′ highs at .9403. Beyond that there is the big figure at 9500 and then parity. Considering how well the pair has held up while the dollar has rallied, also combined with the super thick Kumo below and possible upcoming Tenkan / Kijun cross, we feel the pair is likely headed for another run to the upside should it break and close above the upper trendline.
USD/CAD – Will it Break Parity?
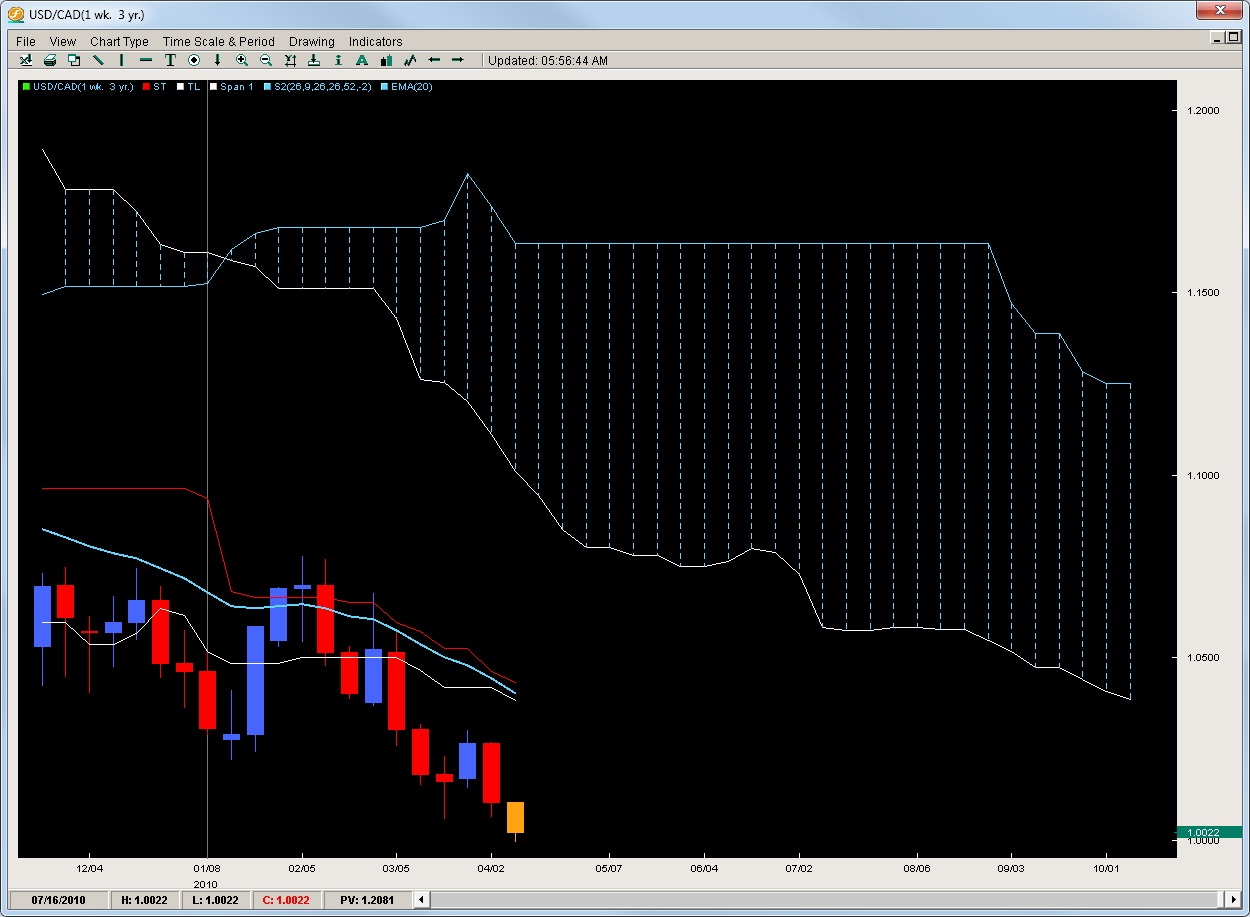
Considering the pair has sold off 7 out of the last 10 weeks and rejected off the 20ema 2x in the last month, we feel the pair is likely headed for further downside. All three lines (tenkan, 20ema and kijun) are all falling at a strong angle so even though there is no new signal, the current downside signal in play remains. Moves back up to 1.0200 should be considered as good rejection plays to short the pair again. Also breaks of parity with closes below on a daily candle will also trigger fresh sales.
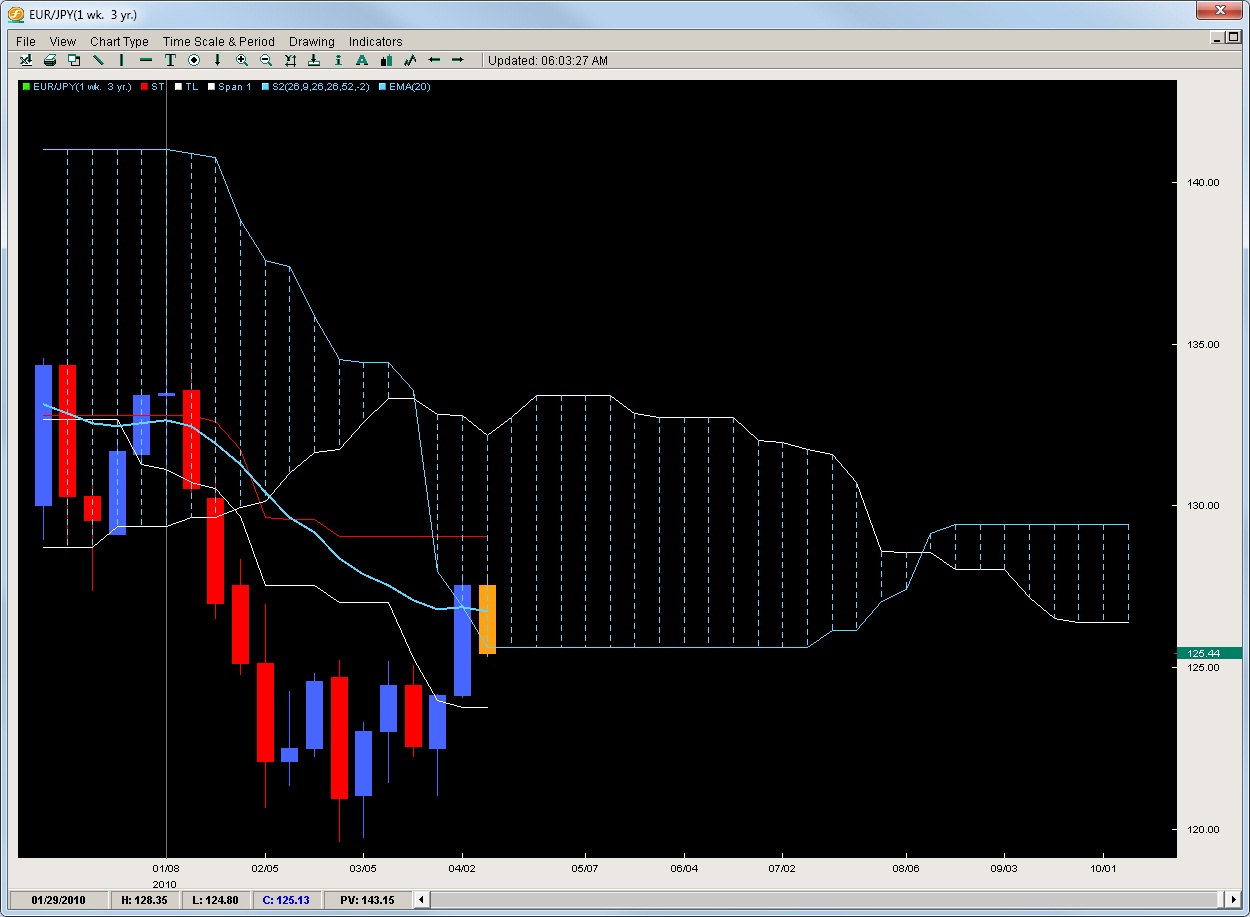
EUR/JPY – Previous Ceiling = Possible Floor?
Just when the pair was set to make another good upside push, the pair got slammed to start the week and is already down about 240pips. The pair literally opened and sold off from the beginning suggesting last weeks break and close above the 20ema may have been a false reality and created a bull trap.
The pair was stuck in a range between 120.00 and 125.00 for 2-months and is rapidly approaching the previous range ceiling at the big figure. Should this level collapse – the pair could be set for another run down back to 120.00 but will have to get past the Tenkan first where some longs may be parked. The alternate scenario is the 125.00 floor holds and sends the pair back up but considering how strong and impulsive the fall is, we’d rather wait for a 2nd touch or double bottom a day after the 1st touch before we consider putting any longs up.
This is just some of the techniques and methods we use to trade the markets. If you are serious about learning how to trade and advancing your learning curve, then check out our courses such as the Advanced Ichimoku and Price Action Courses for further training where you can also join a community of traders and get permanent access to our forum for continual education. For more information about our services, visit https://2ndskiesforex.com
Chris Capre is the current Fund Manager for White Knight Investments (www.whiteknightfxi.com/index.html). He specializes in the technical aspects of trading particularly using Ichimoku, Momentum, Bollinger Band, Pivot and Price Action models to trade the markets. He is considered to be at the cutting edge of Technical Analysis and is well regarded for his Ichimoku Analysis, along with building trading systems and Risk Reduction in trading applications. For more information about his services or his company, visit www.2ndskies.com.
