Combine multiple indicators with PowerRatings
Here’s an in-depth look at a
PowerRatings
setup from last week.
On 06/12/06 MEMC Electronic Materials
(
WFR |
Quote |
Chart |
News |
PowerRating) had a
PowerRating
of 10 and was highlighted in the
TradingMarkets 7 PowerRatings Stocks You Need To Know For This Week as a
stock to watch. This list is designed to help provide readers with some possible
trading ideas; by no means is it a recommendation to buy or sell any of the
stocks on the list. That said, the column occasionally picks a stock that does
well, as was the case with WFR last week.
PowerRatings tend to work best when you can combine them with existing
strategies or create strategies that compliment them. It is usually a good sign
when multiple indicators line up, creating a high probability setup.
The chart below shows WFR hit a high of $48.89 on 05/08/06, then lost 39% to hit
a low of $30 on 06/08/06. After Friday’s close WFR’s PowerRating reached 10, but
were there any other signs it was about to move higher? Let’s take a look.
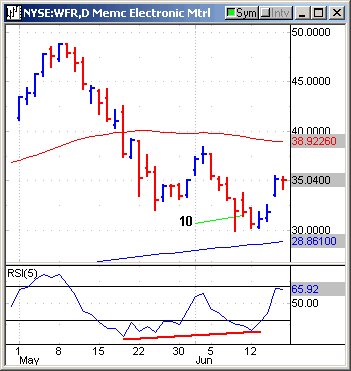
WFR was trading below its 50-day
moving average
but still above its 200-day MA, which was sloping upward — a bullish sign. The
5-day RSI was also showing a positive divergence — another bullish sign.
Remember PowerRatings are based on the likely performance of a stock versus the
S&P 500 over the next five-days so it makes sense to set the RSI to 5.
This alignment of indicators appeared to be enough as WFR rose 10.29% over the
next five-days. Meanwhile, despite Thursday’s rally the S&P 500 lost 0.06% over
the same time period.
You can
attend a free
class on how to use
PowerRatings,
presented by Steve Primo, our Director of Education.
Click here
to take a free trial of
Ashton Dorkins
Editor-in-Chief
Want a free month of
PowerRatings?
Send us your
PowerRatings
strategy and receive one free month of this exciting trading tool. If you are
already a monthly or annual
PowerRatings
subscriber, you will receive an additional three months if we publish your
strategy.