Combining Trading Strategies to Improve Your Odds
Stacked In Favor
All days are not equal when it comes to intraday trading e-mini futures. Some have a built-in edge of moving higher or lower based on pure statistical odds of probability. As anyone who understands stats well knows that it always plays out to perfection over any extended length of time.
Pivotal Probability
Let’s discuss two (of many) rather common market occurrences that have a greater than 50% probability of outcome in stock index markets. The first one is price action touching its daily pivot point value somewhere inside of the cash session period. Over the course of time, stock index markets touch their daily pivot point values roughly 70% of the time. That means seven out of ten, fourteen out of twenty sessions per given calendar month will at some point touch the daily pivot between opening and closing bells.
Most of those days where the pivot point is touched includes multiple hits. A few sessions, the obligatory pivot tap will mark session highs or lows. There are all manner of possible behavior included there… which negates using the pivot itself as a defined strategy with any edge on its own. However, there are certain situations which develop intraday that take this overall stat which creates some high-odds situations to trade. Sometimes that begins right off the opening bell, other times it sets up somewhere else inside the intraday session.
Regardless, any profession based on odds of probability and repeated pattern behavior would consider predictable occurrence at 70ish% to be unbelievable. How many professional card players will pass up ante-raise into a big pot when their hand is perceived to have that type of edge for winning?
Better Yet
There is an even higher-odds edge than that when it pertains to daily pivot point touches intraday. Inside a given calendar year, you can count the times on one hand with fingers to spare where two consecutive sessions fail to hit daily pivot point values. Which means on the sessions that follow a session where the daily pivot value was not touched, there is an extremely strong probability that the daily pivot will be hit inside this session. Many times we’ll see where the next day following an untouched pivot event opens for trading very near or right at the pivot value for this session. It fulfills that probability right off the bat, whereupon any edge then ceases to exist. But, every now & then there will be days following a no-hit pivot that trade well away from that value. Those are conditions where the daily pivot beckons like a tractor beam… and the later it gets in a day, the stronger that magnetic pull on price action becomes.
Closing The Gaps
A second measurable event would be gap-open sessions. Any open gap on an intraday basis is probable to be filled inside of that dame session roughly 75% of the time. In other words, three out of every four gap-open events will fill that gap by or before the opening bell. One out of four gap-open events (on average) will remain open all day… aka gap & go trend session.
Plain & simple, every gap-open session can be expected to close with roughly 75% probability of that coming to fruition. Now, it doesn’t mean someone can start fading a market right from the opening bell while expecting a gap fill. Many if not most times the market will push away from its opening gap for some time and distance before the actual gap-fill happens. Meanwhile, anyone stupid enough to blindly fade the market because a gap is highly probable to fill is certain to go broke sooner or later… most likely sooner.
Using this type of statistical odds will keep astute traders on the correct side of price direction more often than not, which is all we can ever ask for in the first place.
01/16/2009 ES 10-Minute Chart
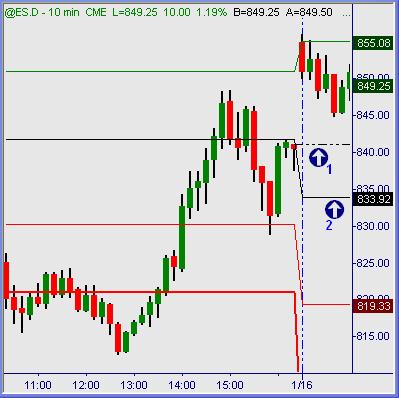
In this example we see where price action in the ES futures opened on a gap-up from the prior session’s close. The S1 value level happened to be where price action opened, and therefore served as an arbitrary point of action from there. Resistance held a couple of tests, and regardless of all else the open gap near 840 level (arrow 1) and then daily pivot point value (arrow 2) were high-odds price magnets to be hit sometime by/before the closing bell rings.
01/16/2009 ES 10-Minute Chart
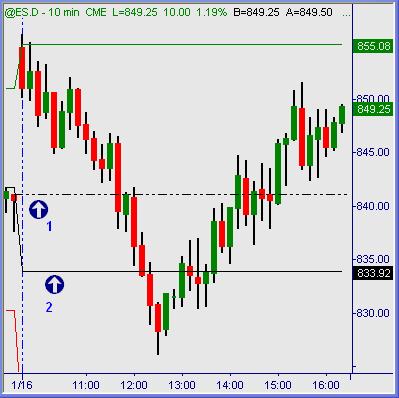
As usual, in other words according to a majority of happenstance, price action eventually rolled lower to hit both high-odds objectives by noon EST. From those points onward, price action had equal odds to go either direction at will. It was the timeframe from opening bell until first the open gap and then secondly the untouched daily pivot were hit that savvy traders knew which way had greatest odds, i.e. giving them a defined edge to base trades from.
01/15/2009 ES 10-Minute Chart
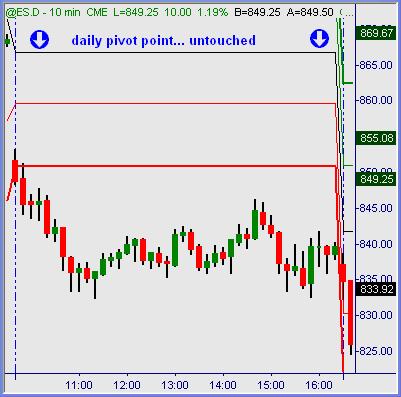
At the open for pit-session trading on Jan 15th, we can see where the daily pivot point value from prior session went untouched. That is an extremely high-odds event setting itself up. As we noted earlier, inside a given calendar year, you can count the times on one hand with fingers to spare where two consecutive sessions fail to hit daily pivot point values. This might very well be one of those rare events… one never knows anything for sure. But how do you want to place your bets? With heavily favored odds, or with extremely low odds of probability?
01/15/2009 ES 10-Minute Chart
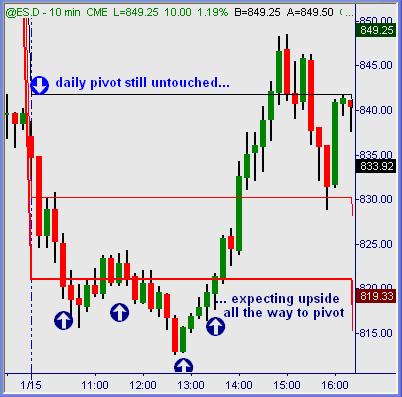
I would imagine most retail traders assumed that the market would keep selling off into oblivion right through the closing bell. After all, it is basic human expectation that current conditions in any aspect of life will project forward forever. We simply are not deliberately wired to anticipate and logically expect change. But there wasn’t a single trader in my room who expected anything other than pivot-point touch from the lows, no matter what. All day long we planned on going long, based purely on statistical probability. That outlook is correct far more often than not over the course of time… and it’s fun being right to a high degree versus being wrong.
Persistent shorts got torched like roman candles through that updraft, widely expected by those who know enough to know where high odds of probability exist. It took well into the late afternoon period, but traders armed with invaluable information based on hard stats were not at all surprised by the afternoon ramp romping its way up the chart. We expected exactly that.
Summation
Some days have certain situations that are more predictable than others based on pure statistics alone. Unskilled traders make themselves believe that random chaos rules price action. Not true. A poor carpenter always blames his tools. The more learned and skilled a trader becomes, the greater degree of orderliness and predictability they see in measured price movements. Open gaps and untouched daily pivot points are merely two of numerous ways to keep yourself on the correct side of pending price direction far more often than not.
Austin Passamonte is a full-time professional trader who specializes in E-mini stock index futures and commodity markets. Mr. Passamonte’s trading approach uses proprietary chart patterns found on an intraday basis. Austin trades privately in the Finger Lakes region of New York. Click here to visit CoiledMarkets.
Click here to sign up for a free, online presentation by Larry Connors, CEO and founder of TradingMarkets, as he introduces The Machine, the first and only financial software that allows traders and investors to design and build quantified portfolios.