Commodities may be ready to take-off again
A tame reaction to yesterday’s
Federal Reserve Board meeting enabled the S&P 500 to post its sixth straight day
of gains and once again finish at a new five and a half year high.
Just as everyone on Wall Street expected, interest rates were left unchanged. As
usual, stocks acted neurotically immediately following the FOMC announcement,
but they stabilized and closed in positive territory. The S&P 500 and S&P Midcap
400 indices both gained 0.4%, while the Nasdaq Composite advanced 0.5%. The
small-cap Russell 2000 perked up, rallying 0.6%, but the Dow Jones Industrial
Average lagged with a 0.1% gain. Each of the major indices finished in the upper
20% of their intraday ranges.
Turnover rose across the board yesterday, enabling both the
S&P and Nasdaq to register bullish “accumulation days.” In the NYSE, total
volume increased by 8%, while volume in the Nasdaq was 10% higher than the
previous day’s level. After registering a bearish “distribution day” in the
previous session, it’s positive that the Nasdaq was able to follow up with a
session of institutional accumulation. Overall volume levels were healthy as
well, as volume in the NYSE was at its highest level since October 4. In both
exchanges, advancing volume exceeded declining volume by ratio of just under 2
to 1.
Beneath the relatively modest percentage gains of the major
indices, several industry sectors surged higher yesterday. As anticipated, gold
stocks began following through on spot gold’s inverse “head and shoulders”
pattern that we analyzed in yesterday’s
The
Wagner Daily. The CBOE Gold Index ($GOX) vaulted 3.5% higher, causing
the first half of our long entry in the StreetTRACKS Gold Trust [GLDGLD] to
trigger. We bought half of our GLD position on the breakout above the 20-day
moving average, and will buy the remainder of the shares on a breakout above the
October 19 high. Such a rally would confirm the bullish inverse “head and
shoulders” chart pattern, as the “neckline” would be broken. More importantly,
the five-month downtrend line, as well as the 50 and 200-day moving averages,
would also be broken. We really liked the action in gold sector yesterday and
feel pretty confident the gold stocks and ETFs will continue higher in the short
to intermediate-term.
In addition to GLD, which trades at roughly one-tenth the
price of the spot gold commodity, there are a few other related ETFs that you
may not be aware of. The iShares Gold Trust
(
IAU |
Quote |
Chart |
News |
PowerRating) is a competitor of GLD and
has a nearly identical chart pattern. The only difference is that GLD trades a
lot higher average daily volume. On a slightly different note, don’t forget
about the iShares Silver Trust
(
SLV |
Quote |
Chart |
News |
PowerRating), which trades at about ten times the
price of one ounce of the spot silver commodity. Less people pay attention to
silver, but the reality is that SLV showed more relative strength than GLD
during the recent correction.
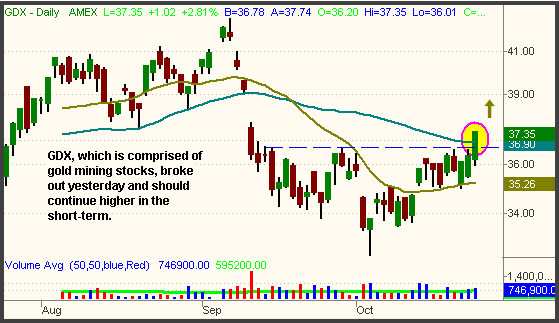
The Market Vectors Gold Miners
(
GDX |
Quote |
Chart |
News |
PowerRating) is a relatively new
ETF composed of individual gold mining stocks, as opposed to merely being
tied to the price of spot gold. Looking at the chart of GDX below, notice how it
has a similar inverse “head and shoulders” pattern as GLD, but is already
breaking out above its “neckline.” It also closed yesterday above its 50-day MA
for the first time since September 9:

GDX has less price history than GLD, so its long-term chart
pattern is more difficult to define, but we like its relative strength and
bullish daily chart pattern. We did not buy GDX in our hedge fund yesterday, but
we did take positions in a few individual gold mining stocks, as well as in GLD.
Another impressive performer yesterday was the Oil Service
Index ($OSX), which rallied 2.3%. The Oil Service HOLDR (OIH), which we bought
when it broke out above its five-month downtrend line, has shown excellent price
action by gaining nearly 8 points (just over 6%) in the past two days. Our
upside price target is still resistance of the 200-day moving average, which is
about 4.5 points above yesterday’s closing price. After such a strong run in a
short period of time, OIH may consolidate for a few days, but we would be
surprised if it gives back much of the recent gain. A brief consolidation would
actually be a good thing because it would enable OIH to build a base of support
from which to stage its next breakout. Note that OIH is showing much more
relative strength than the U.S. Oil Fund
(
USO |
Quote |
Chart |
News |
PowerRating), which is loosely correlated
to the price of the crude oil commodity. We would continue to avoid USO, but
there are a plethora of other energy-related ETFs that are showing similar
strength to OIH. For a complete list of all the energy ETFs, check out the
“Sector/Industry” page of the free
Morpheus
ETF Roundup.
With gold and oil seeing such positive institutional money
flow over the past few days, one can surmise that commodities in general are
picking up strength. After a five-month correction, they may be ready to once
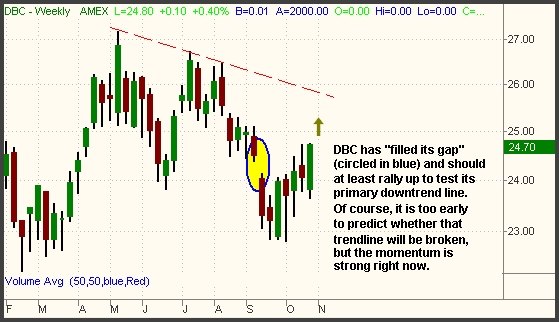
again take off. If you want to have an easy way to capture a general move in the
commodities market, check out the DB Commodity Index Trust
(
DBC |
Quote |
Chart |
News |
PowerRating). As you can
see on the long-term weekly chart below, DBC has “filled its gap” from last
month and still has more than a point to go until running into resistance of its
primary downtrend line:

As for the broad market, what can we say? The major indices
are certainly strong and remain glued to the upper range of their uptrend
channels without showing any major signs of correction. Obviously, a price
retracement will eventually come, but remember that “overbought” markets can
remain that way for a long time. If you’re not presently long the market, there
is clearly a high risk for entering near current prices. However, one way to
participate in the bullish action without exposing yourself to major risk is to
focus on the industry sectors that trade largely independently of the broad
market. Gold and Oil Service, both of which we are long, are two great
examples of this. A price correction in the S&P, Dow, or Nasdaq will not
necessarily affect these sectors because they are commodity-driven. If you’re
already long the broad market and are sitting on healthy gains, you might even
consider closing some positions into strength and rotating some of that capital
into sectors that are less susceptible to the broad-based pullback that will
inevitably come.
Open ETF positions:
Long OIH, GLD, short KCE, IWM (regular subscribers to
The Wagner Daily receive detailed stop and target prices on open
positions and detailed setup information on new ETF trade entry prices. Intraday
e-mail alerts are also sent as needed.)
Deron Wagner is the head trader of
Morpheus Capital Hedge Fund and founder of Morpheus Trading Group (morpheustrading.com),
which he launched in 2001. Wagner appears on his best-selling video, Sector
Trading Strategies (Marketplace Books, June 2002), and is co-author of both The
Long-Term Day Trader (Career Press, April 2000) and The After-Hours Trader
(McGraw Hill, August 2000). Past television appearances include CNBC, ABC, and
Yahoo! FinanceVision. He is also a frequent guest speaker at various trading and
financial conferences around the world. For a free trial to the full version of
The Wagner Daily or to learn about Deron’s other services, visit
morpheustrading.com
or send an e-mail to
deron@morpheustrading.com .
