Commodity ETFs provide the best setups
The stock market began last Friday’s
post-holiday session with a large opening gap down, but recovered a portion of
those losses later in the morning before closing at 1:00 pm EST. The
Nasdaq Composite again exhibited relative strength by closing only 0.2% lower
compared to the 0.4% loss in the S&P 500. Intraday action also confirmed the
price divergence, as the Nasdaq briefly recovered into positive territory two
hours after the open, but the S&P showed a loss throughout the entire day. Like
the S&P 500, the Dow Jones Industrial Average also fell 0.4%, but both the
small-cap Russell 2000 and S&P Midcap 400 indices gave up only 0.1%.
With the stock market concluding three hours early, turnover
obviously declined sharply in both exchanges. In the NYSE, total volume was 61%
lower than the previous day’s level. Volume in the Nasdaq declined by 58%.
Adjusted for the early closing time, volume in the NYSE was still 36% lighter
than the previous day at 1:00 pm EST. The Nasdaq volume was on pace to be 29%
lower. The minimal number of shares that traded hands means that Friday’s price
action was not confirmed due to the absence of institutional trading activity.
Beneath the surface, however, market internals were negative. In the Nasdaq,
declining volume exceeded advancing volume by a margin of 2 to 1. The ratio in
the NYSE was negative by 1.2 to 1.
Not surprisingly, most industry sectors closed within 1% of
unchanged in Friday’s shortened session. But to our satisfaction, gold was the
one exception. A $10 per ounce overnight jump in the price of the spot gold
commodity caused our long position in the StreetTRACKS Gold Trust
(
GLD |
Quote |
Chart |
News |
PowerRating) to
correspondingly rally 1.6% and finish at its highest level since August 9.
Individual gold mining stocks performed even better than spot gold, as the CBOE
Gold Index ($GOX) zoomed 2.6% higher. In the November 22 issue of
The Wagner Daily,
we illustrated a weekly chart of GLD and mentioned that we soon expect a
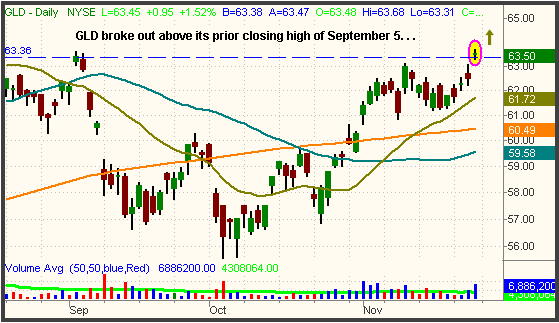
breakout above the three-week range. This breakout came on Friday, as you can
see on the daily chart below:

Since our initial entry one month ago, GLD is showing an
unrealized gain of more than 8%, but we remain long because the ETF has not yet
given us a good reason to sell. Many new traders mistakenly think that a high
percentage of accuracy on your stock or ETF picks is necessary in order to be
consistently profitable, but this is not true. On average, we make a profit on
only about 40 – 50% of our trades, BUT the dollar gain of our average
winner is usually close to double the loss of the average loser. While simple
math dictates that such statistics will result in a long-term winning strategy,
the key point is that net profitability can only occur from maximizing profits
on the winners and being disciplined with stop losses on the losers. Though we
set price targets on our trades, they are only to be used as a guideline. If a
position is acting very well, we will sometimes raise our target because there
is no reason to sell. However, we always trail an increasingly tightening stop
in order to protect profits just in case the stock or ETF surprises us. With GLD,
our new price target is just below resistance of the August 2006 high of 65.22.
We plan to sell into strength as GLD approaches that level because it is a
logical resistance level at which it will likely take a break and at least
correct by time before moving much higher.
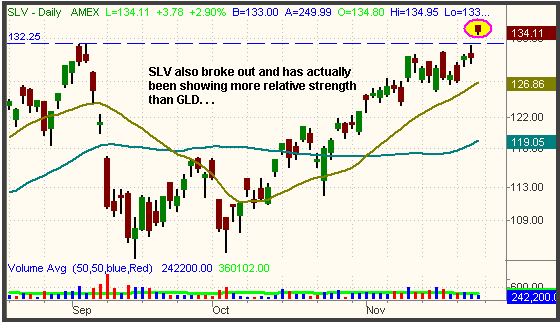
Spot silver has been showing even more relative strength than
gold, and don’t forget that the iShares Silver Trust
(
SLV |
Quote |
Chart |
News |
PowerRating) is a great way to
participate in a corresponding move in the silver commodity. Check out last
Friday’s breakout:

In addition to its bullish technical pattern, major weakness
in the U.S. dollar is one reason gold has been doing well. As you may recall, we
began following the bullish chart pattern in the CurrencyShares Euro Trust
(
FXE |
Quote |
Chart |
News |
PowerRating)
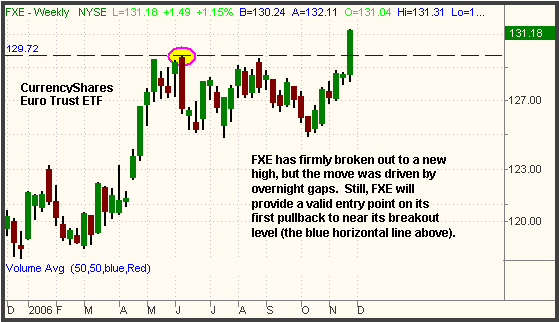
just before it broke out on November 22. That day, FXE gained 0.8%, then
followed up the move with another 1.1% gain on November 24. Unfortunately, it
has been difficult to directly profit from the breakout because both days’ gains
have been the result of large opening gaps, not intraday strength. Because we
have clearly defined rules regarding opening gaps, the
MTG Opening Gap Rules, the only way we could have profited from the FXE
strength is to have bought the consolidation before it actually broke out. But
buying consolidations without waiting for confirmation of the breakout carries a
much higher risk. Regardless, the strength in FXE has been impressive and we
like the idea of buying the first pullback to near support of the breakout
level. As the weekly chart below illustrates, a pullback to just below the $130
level would provide an ideal entry point if not already long:

In addition to gold, we are watching for a potential breakout
above the sideways range of the Semiconductor Index ($SOX). Since rallying above
its 200-day MA and weekly downtrend line on November 14, the $SOX has been
consolidating in a narrow range that may serve as a base from which to make
another leg up. However, the only thing that makes us a little bit reluctant to
aggressively buy a $SOX breakout is that the major indices remain extended
pretty far away from support of the lower channels of their uptrend lines. Even
though the $SOX looks good, the sector may be out of sync with the broad market
because its rally came in the late stages of the broad market’s rally. If the
market begins to correct, the $SOX may have a tough time holding up.
Nevertheless, there’s no major risk in buying a breakout in the Semiconductor
HOLDR
(
SMH |
Quote |
Chart |
News |
PowerRating), the iShares Semiconductor
(
IGW |
Quote |
Chart |
News |
PowerRating), or any of the others, but
you might consider reducing your position size and keeping a tighter than usual
stop in order to minimize your risk in the event of a failed breakout.
Finally, be on the lookout for a breakout in crude oil and/or
the various oil-related ETFs. We recently pointed out the bullish setup in the
Oil Service HOLDR
(
OIH |
Quote |
Chart |
News |
PowerRating), and we continue to feel it will break out sometime
within the next few days. We already bought OIH when it crossed above its
200-day MA last Friday, but it drifted lower into the close. Still, it finished
near the pivot on its fifth attempt to close above the 200-day MA, so it
should go soon. If interested in an ETF that loosely mirrors the price of the
actual crude oil commodity, the U.S. Oil Fund
(
USO |
Quote |
Chart |
News |
PowerRating) is the one to watch, but
it’s still glued to its low and therefore carries higher risk of a bottom not
yet being firmly established.
Open ETF positions:
Long GLD, OIH, PBW (regular subscribers to
The Wagner Daily
receive detailed stop and target prices on open positions and detailed setup
information on new ETF trade entry prices. Intraday e-mail alerts are also sent
as needed.)
Deron Wagner is the head trader
of Morpheus Capital Hedge Fund and founder of Morpheus Trading Group (morpheustrading.com),
which he launched in 2001. Wagner appears on his best-selling video, Sector
Trading Strategies (Marketplace Books, June 2002), and is co-author of both The
Long-Term Day Trader (Career Press, April 2000) and The After-Hours Trader
(McGraw Hill, August 2000). Past television appearances include CNBC, ABC, and
Yahoo! FinanceVision. He is also a frequent guest speaker at various trading and
financial conferences around the world. For a free trial to the full version of
The Wagner Daily or to learn about Deron’s other services, visit
morpheustrading.com or send an e-mail to
deron@morpheustrading.com .
