Confluence Is Coming
Pattern, Price, and Time
Cycles. When I can get all three of these ingredients to align, then a high-probability trade usually exists right around the corner. Right now, I am seeing
all three of these items come together in the S&P 500 SPDRs (SPY).
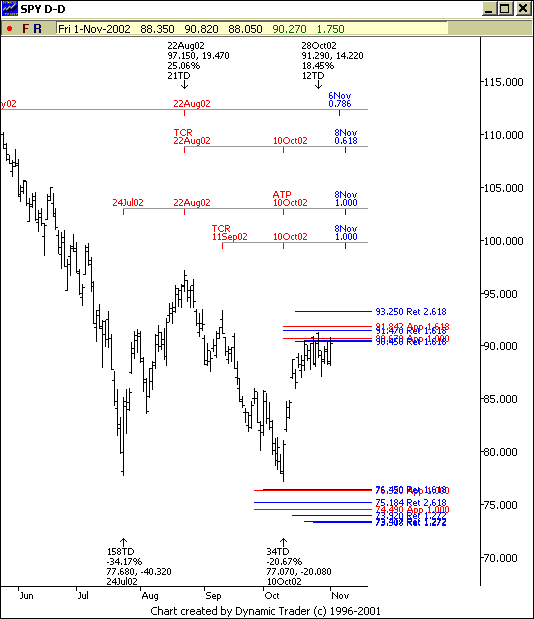
1) On the daily chart
we are hitting key Fibonacci price resistance.2) Focus time cycles for a reversal to the downside come into play around
Nov. 6-8 on the daily chart3) When I drill down to a 60-minute chart to see what the market looks like,
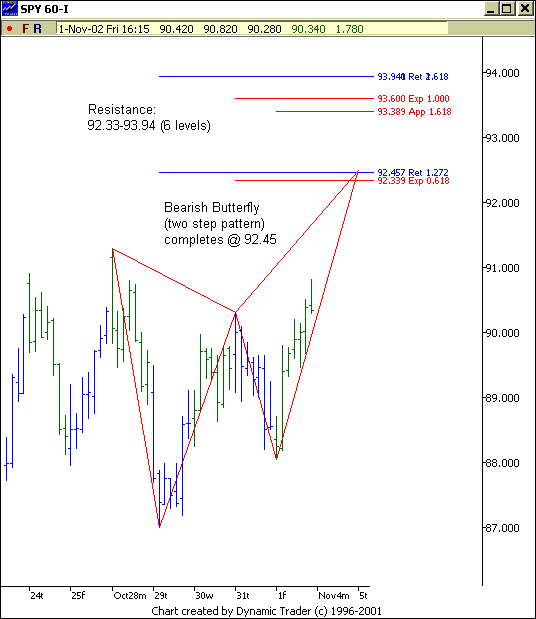
I see a very interesting pattern developing.
a. A Bearish Butterfly
Pattern (two step pattern) is in the process of being formed. The pattern
officially completes @ 92.45. This price level is part of a Fibonacci resistance
zone that extends from 92.33-93.94.
So, based on these charts,
it looks like we could make new highs early in the week and pull additional
long players into this market. However, once we come up into this resistance
area mixed with our time cycles and the bearish pattern, there is a high likelihood
we get some type of reversal. I don’t know how significant it could be but the
analysis tells me that it is very likely.
OK…so what if we don’t reverse? What
if the market rams right through this resistance? Well, then SPY is telling
me to focus on the long side and to buy pullbacks into Fibonacci support zones.
But not until we clear 60-minute and daily chart focus resistance.


