Connors Research Traders Journal (Volume 42): Optimize Your Trading By Understanding Volatility Regimes
The following is an excerpt from research presented in our upcoming book “The Alpha Formula” which will be released this summer.
Knowing what kind of market you are in is an important step in developing a trading strategy.
Ideally, you want your strategy to be optimized for the current market – some strategies do better in higher volatility environments and some do better in lower volatility environments.
A consistent finding by Connors Research is that volatility is significantly different in bull markets vs bear markets. Markets tend to be much more volatile when they are in bear market mode compared to when they are in bull market mode.
This information can be used as a regime filter for your trading strategies, turning different strategies on or off based on the market environment. It also allows us to position size better which means your trading and portfolio results have a better chance of succeeding with less fluctuation.
We have previously presented research showing this to be the case in large cap US stocks. We did the same with VIX. In this article, we will expand this research further for you to show that this has been the case not only for large cap US stocks, and VIX, but also for the total US stock market (all caps), small cap US stocks, real estate, and fixed income!
The following is a table summarizing the characteristics of the Total US Stock market over nearly four decades, as measured by the Wilshire 5000 when it is above and below its 200-day moving average.
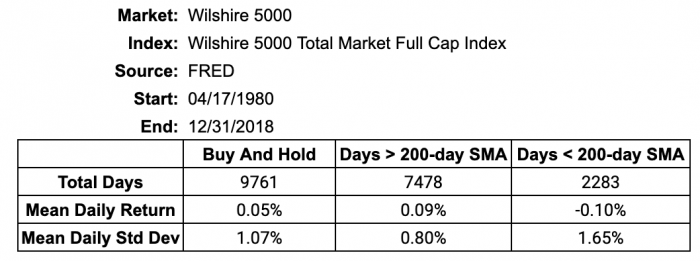
Notice the daily mean standard deviation, a measure of market volatility, is significantly higher during the days when the market is below its 200-day SMA. Specifically, we observe daily volatility of 0.80% for the days when the market is trending higher vs 1.65% for days when the market is trending lower. The market is over two times more volatile on the downside!
Let’s extend this research to other markets. The first is US Small Cap stocks. The following table summarizes the results for the past 19 years:
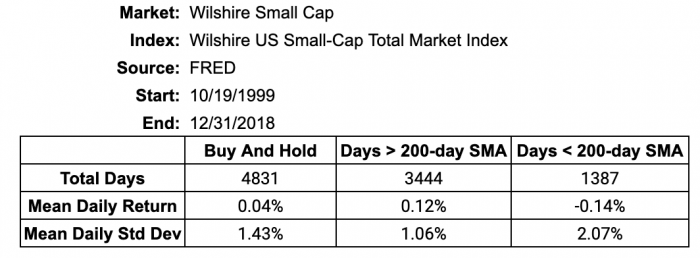
We see the same tendency here. Notice the daily mean standard deviation over the 3444 trading days when the price was above the 200-day SMA coming in at 1.06% vs 2.07% for days when the price was below the 200-day SMA.
Again, there’s been a significant difference in volatility here for US small caps, this time by nearly double again.
Does this same behavior hold when applied to other asset classes?
Let’s take a look at US Real Estate and long duration US Corporate bonds, two separate asset classes from the equity indices we have seen so far. Here are the historical test results.
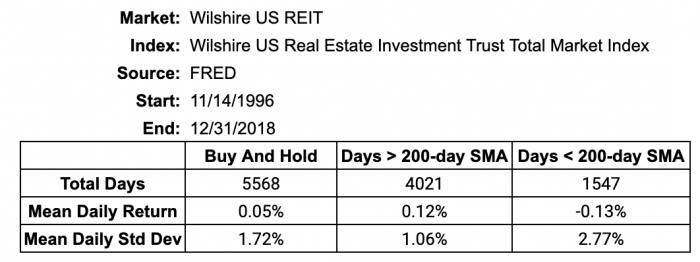
The same results are seen when this research is applied to other assets. US real estate daily mean volatility went from 1.06% to 2.77%, more than 2.5 times higher!

The results for corporate bonds, a naturally lower volatility asset class, wasn’t as dramatic (which is to be expected) but still showed a healthy difference in volatility.
Summary Of Results
The following table summarizes our findings. We annualized the daily mean standard deviation here for you as well.
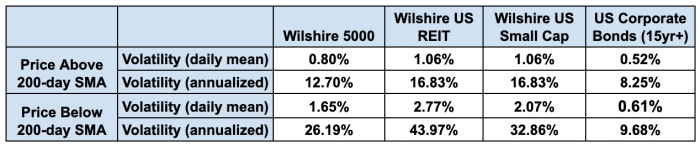
Bottom line – volatility is higher in downtrending markets and lower in uptrending ones. This works across multiple asset classes as we have shown.
So where are we now?
In the current market, US Large Caps, Real Estate, and corporate bonds are well above their 200-day SMA, indicating a lower volatility regime. US Small Caps, however, are below their 200-day SMA.
Applying This Knowledge
There are two key takeaways for you from this research:
- Volatility tends to rise in many asset classes (Large Cap stocks, Small Cap Stocks, Real Estate, and Fixed Income) when the indices are in downtrends.
Also, prices, on a short-term basis have tended to rise when they’re above their 200-day SMA, and have tended to decline when they’ve been below their 200-day SMA.
From this, you can deduce that the wind has been at your back when buying assets above their 200-day ma, and on the other side (below the 200-day SMA), bottom fishing has been a game where the odds have never been in your favor.
2. If you know that volatility is likely going to be higher below the 200-day SMA, and you decide to be long assets when they are, you may want to consider adjusting your position size lower in order to normalize the volatility of your positions. It should be obvious that trading in a high volatility environment is going to increase your risk and you can potentially lessen that risk by adjusting your size.
We’ll continue to provide you with research on this topic because combining directional edges with volatility adjustments based on market regimes is a great way to potentially improve your returns while decreasing your risk.
If you have any questions or comments on the research presented above, please feel free to email us at lconnors@connorsresearch.com or ccain@connorsresearch.com
Additional
- We came across this well-written article on the advantages of programming in Python. We’ve moved much of our research testing onto Python, as have many professionals in the industry. This article does a good job of discussing the plusses of Python for Traders.
https://artursepp.com/2018/10/24/why-python-for-quantitative-trading/
We also point out that the volatility analysis done for today’s Research Journal was done in Python.
- If you don’t already know, my co-author of Street Smarts, Linda Raschke, has written an autobiography of her great career as a professional trader. You can find Linda’s new book here…https://lindaraschke.net/trading-sardines/
- Each year, TradingMarkets.com does a Memorial Day Weekend Sale on our books and trading courses. If you’re interested in expanding your trading knowledge this weekend, you can learn more here.
Have a Great Weekend!
Larry Connors & Chris Cain, CMT