Connors Research Traders Journal (Volume 64): 3 Rules – A Nearly 500% Increase in Cumulative Returns
Can your trading and portfolio returns be increased by combining the best of technical analysis, fundamental analysis, and quantitative analysis (known as “Quantamentals”)?
In our opinion, and based firmly on the data, the answer is yes…oftentimes by a great amount.
We’ve been publishing trading and investing research since 1995. Based on what we’re seeing from the strategies we’re creating, Quantamentals is the most exciting line of research we’ve been involved with. The potential, in our opinion, is unlimited.
In this issue, we will walk you through an example of this type of next-generation thinking.
We will show you how combining fundamentals, technicals, and quant gives you the opportunity to take your trading and investing to the next level. In today’s example, it increases the cumulative returns of one strategy by nearly 500% from 2003-September 2019.
Shareholder Yield – A Well Regarded Fundamental Indicator
For this example, we will use the fundamental metric known as “shareholder yield”, a popular fundamental indicator used by money managers.
Shareholder yield measures the total amount of capital returned to shareholders directly in the form of dividends or indirectly in the form of stock buybacks.
Shareholder yield is obtained by simply adding up the dividend yield and the buyback yield.
Dividend Yield + Buyback Yield = Shareholder Yield
Applying Shareholder Yield From 2003-2019
We will first look at the performance of a simple strategy that buys the top decile (top 10%) of stocks based on shareholder yield.
The stock universe we’ll use for these tests is the Q500 – the 500 most liquid US stocks based on average trailing 200-day volume.
This strategy simply rebalances the portfolio to the 50 stocks with the highest shareholder yield on a monthly basis. Let’s compare this strategy to the buy and hold performance of the ETF “SPY”.
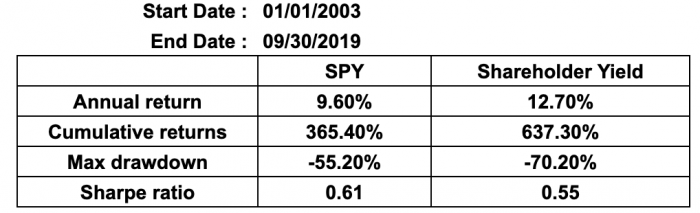
As you can see, buying the top 50 stocks based on shareholder yield resulted in higher returns vs. buy and hold, but a drawdown of over 70%!
Even though the cumulative returns increased from 365% to 637% none of us wants to live through a 70% drawdown.
First Line of Attack – Lower the Drawdown!
The first line of attack is to look to substantially lower the drawdown without giving up much of the excess returns.
Technical analysis trend indicators will often do this.
Even though we have many to choose from, for the sake of simplicity, let’s apply the popular 200-day moving average.
Adding In Technical Analysis – Applying a Trend Following Filter
By adding in the 200-day moving average as an on/off switch whether to add new positions or not often improves historical results.
This updated test now continues to buy the top 50 stocks with the highest shareholder yield, but only if the price of the ETF “SPY” is above its 200-day moving average.
If not, no new entries are taken and we move our capital to cash – represented by the ETF “SHY” (1-3yr US Treasuries).
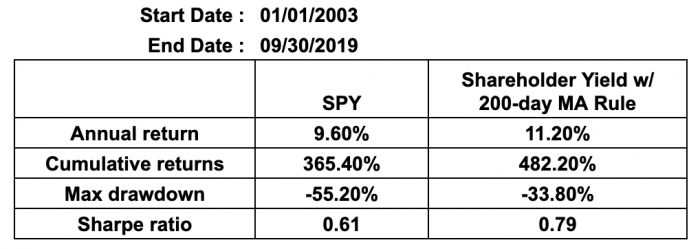
Adding a technical analysis rule accomplished our goal of decreasing the drawdown.
In fact, we see a dramatic decrease compared to Shareholder yield alone (-70.2% vs -33.8%).
Though it did decrease the return slightly, most of us would accept a bit less return in exchange for a dramatic decrease in drawdown.
Let’s Do Better – Adding Quantitative Analysis To Fundamentals and Technicals
Now we’re going to add cross-sectional momentum (commonly referred to as relative strength momentum).
There’s an impressive amount of research published over many decades which shows that stocks which have performed the best in the recent past tend to continue to outperform in the future. Let’s apply this research to improve our strategy.
Instead of investing in the 50 stocks with the highest shareholder yield, we will take those 50 high shareholder yields stocks and invest in the 20 stocks with the highest trailing 6-month momentum (total returns).
Stated another way, we’re buying the 20 stocks which have performed the best over the past 6-months.
Let’s look at what happens…
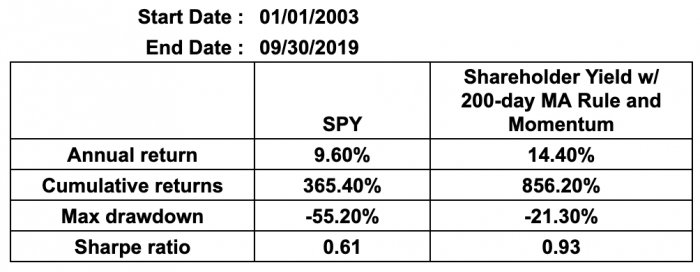
By adding cross-sectional momentum to one well regarded fundamental indicator and one widely-used technical indicator we created:
- Greater Annual Returns – Increased the annual returns to double digits
- Greater Cumulative Returns – Increased the cumulative returns by nearly 500%
- Lower Volatility – Decreased the drawdowns significantly
Combining Fundamentals, Technicals and Quant Often Leads to Significantly Greater Results!
As you can see, by quantifying a well-known fundamental indicator and then simply adding technical analysis with moving averages, and a quantitative technique such as momentum, the portfolio’s performance was greatly improved.
We can show you dozens upon dozens of these examples which are even better than what we see here. The main point is as good as technical analysis (or fundamentals, or quant) is, stacking all three together often gives you significantly greater results.
Coming To TradingMarkets
New content is being added all the time. Watch for research on 0DTE options along with how traders can benefit from AI.
You can sign up now for the first AI course specifically designed for traders. This 17-hour course includes an overview of AI; details on how to apply this technology to trading; and real-world use cases that will equip you to analyze market trends and make time-sensitive trading decisions.
Previous CTA:
New 4 Week Course – Quantamentals – The Next Great Forefront of Trading and Investing
We have numerous Quantamental strategies showing results of well over 20% a year with significantly lower volatility.
In our new upcoming Quantamentals Course, we will be teaching these Quantamental strategies along with providing you with comprehensive ways to apply Quantamentals to your trading and your portfolios.
The Quantamentals Course Includes:
1. Four live 90-minute weekly classes taught by Larry Connors and Chris Cain, CMT teaching you everything you need to know about Quantamentals
2. A number of new cutting edge, proprietary Quantamental Strategies
3. Unlimited access to all the class recordings
4. Full class materials for you to study over and over again
5. Full know-how on how to professionally combine technical analysis with fundamental analysis along with quantitative analysis
6. Chris Cain’s Python code for the strategies taught, including the signal generation
7. A Private FB Group where you will be interacting with Larry and Chris throughout the course
Special Bonus: We will be holding a special follow up Quantamentals “class get together” in early January to assure you’ve mastered all the materials and have your Quantamental strategies in place to get 2020 off to a great start.
Who’s The Quantamentals Course For?
If you have a 6, 7 or 8 figure account and at least 3-5 years of trading experience, this course is for you. Also, everyone enrolled in the course will be signing a nondisclosure agreement (NDA) to assure the strategies stay private within the class.
Quantamentals is the next great forefront of trading and investing. Join the dozens of professional money managers and traders who have already enrolled in the course.
Please listen to this 40-minute webinar which talks about the benefits of Quantamentals.
Or if you’re ready to join the class, call Tim Kiggins at 973-494-7311, ext 616 or register online today here
Class starts next week on October 17 at 4:30 pm. We look forward to you joining us!
Larry Connors & Chris Cain, CMT