Consider This About The QQQs…
Consider The Possibilities
This is NOT a trade set up. This is simply a pondering moment,
and a little bit of chart observation. Through this we can build a longer term
map for trading possibilities as we approach certain levels in the Nasdaq 100
Tracking Stock. Let’s bullet point this:
·      Â
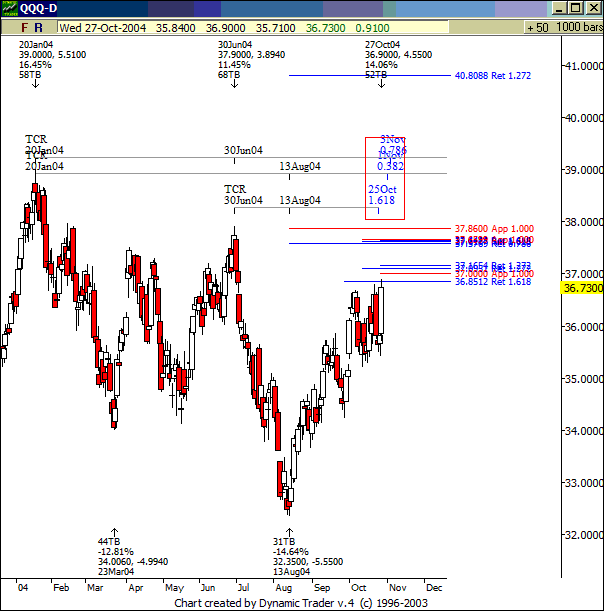
In the first quarter of 2004 we have boxed ourselves into a range
with a high of 39 and a low of 34.
·      Â
Note the 5 consecutive weeks were QQQ hit the .618 to .786 retracement
of our high to low from the first quarter and ultimately failed and traded down
about 10% to about 34. This zone represents a significant price area for the
markets to deal with.
·      Â
 If this market can trade up and close above 38, it will
be running into an Air Pocket scenario that will allow this index to float freely,
and quickly up to the 40 to 42 level.
·      Â
That 40-42 level represents my upside target for the year. It
represents a very critical zone….why?
·      Â
I have outlined, in red, a pattern that would develop IF this
air pocket is hit and we ramp up to 40-42. It is a Bearish Butterfly. This pattern
is very common around market tops and bottoms, and is very rare on weekly time
frame charts like this. So be aware of it.

To summarize:
1.    Â
The zone from 37 to 38 extremely important.
2.    Â
Air Pocket from 38 up to 40
3.    Â
40-42 is a Bearish Butterfly pattern completion
4.    Â
QQQ hits the high for the year and trades down/sideways out of that 40-42
zone.
Next column will focus on the flip-side scenario if we trade
down from here. Just remember this is a “what if†scenario along with key resistance
zones and air pockets. Keep this within viewing distance as you create your
nightly trading plan while trading the Nasdaq 100.
Good night.
Derrik
