Controlling Risk in Short-Term Trading, Part 1
Do you realize that even with a trading strategy that’s profitable 70 percent of the time, about one time in a hundred you’ll experience at least four losing trades in a row? Twice in 1,000 trades, you’ll string together five losses.
Depending on how you handle this downside risk, you could lose a large chunk of your account even with a great trading strategy. Since the short-term trader trades a lot, strings of losses are bound to come. Or, more likely, holding positions overnight occasionally leads to large gaps down in response to bad news. Either scenario puts your account at risk.
Here, I’ll show you how to minimize that risk through controlling your trade size. Let’s start with the strategy.
Simply put, I use a number of fundamental screens crossed with two-year PEG ratios to identify 50-70 stocks that are fundamentally sound with value remaining at their current price. Technically, I then look to enter long their pullbacks, grading the quality of each pullback by TradingMarkets’ PowerRatings and RSI(2) values, See my articles: “How I Apply Connors’ RSI(2) to Trading Pullbacks” (9/29/09), “Trading Pullbacks in Wall Street’s Best Stocks” (7/21/09) and “How I Trade Using Both PowerRatings and Fundamentals” (5/21/09).
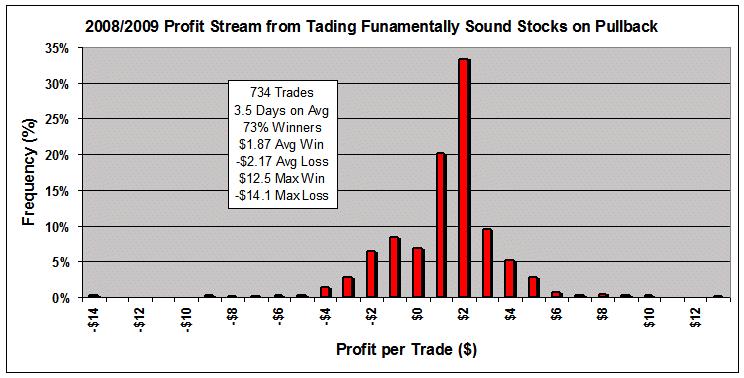
Over the past seven quarters (2008 and the first three quarters of 2009), I used this methodology to forecast 734 half-position trades that averaged 73% winners with an average hold time of 3.5 days (note, these are not necessarily real trades). The distribution of profit is shown in this first chart. On average, the winners returned $1.87 per share, the losers lost $2.17 per share, and there was a small chance of a large gain ($12.5) or large loss ($14.1) that resulted from after hour news. The expected gain for this strategy was:
Expected Gain = 0.73($1.87) – 0.27($2.17) = +$0.78 per share
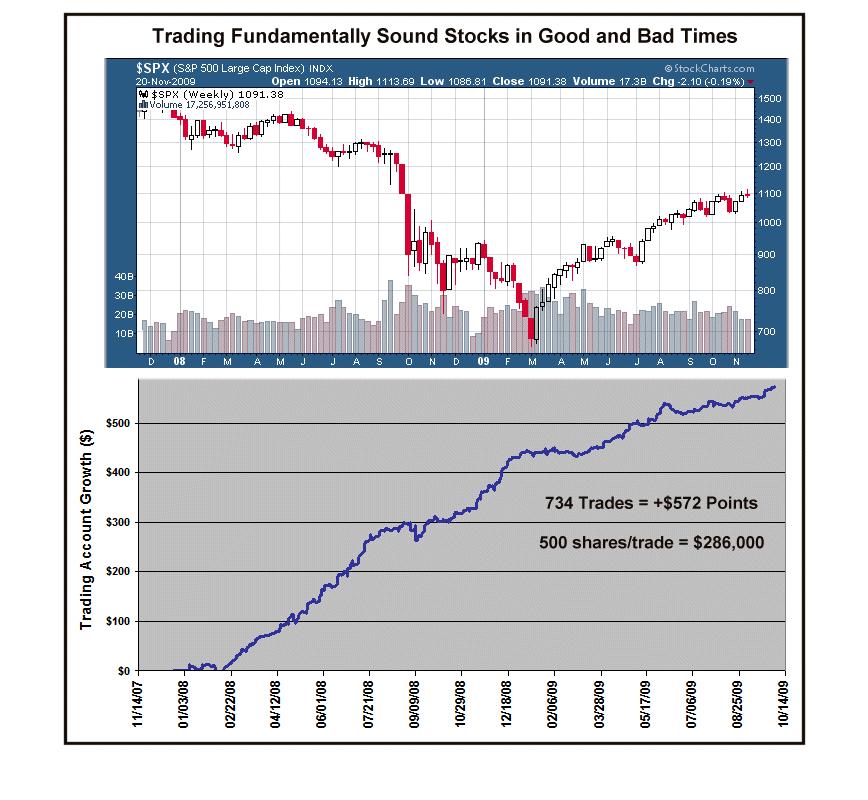
As shown in this next chart, these trades occurred during both bullish and bearish periods in the market. Five hundred share positions established for each of these trades would have generated $286,000. The strategy is sound as shown by its steady return, but what about the trading risk?
Assume that you have a $100k account to trade this strategy, one that produces 73% winners in good and bad markets. The way the trader splits his account among these trades determines the overall risk to the trader’s account (rather than the splitting among non correlating vehicles that modern portfolio theory requires of the longer term investor). Simply put, you could invest the whole account in one great trade or split it among two or more (either concurrent or successive ones).
To assess the risk determined by the number of trades, I used a statistical technique called Re-sampling or Bootstrapping. Basically, these 734 trades form a sample pool that is randomly re-sampled thousands of times. Here, I sampled the pool 10,000 times with replacement for each of ten sample splits among one to ten trades. I then calculated the mean, the 5% and the 95% confidence intervals, the latter two providing a measure of risk to the trading account.
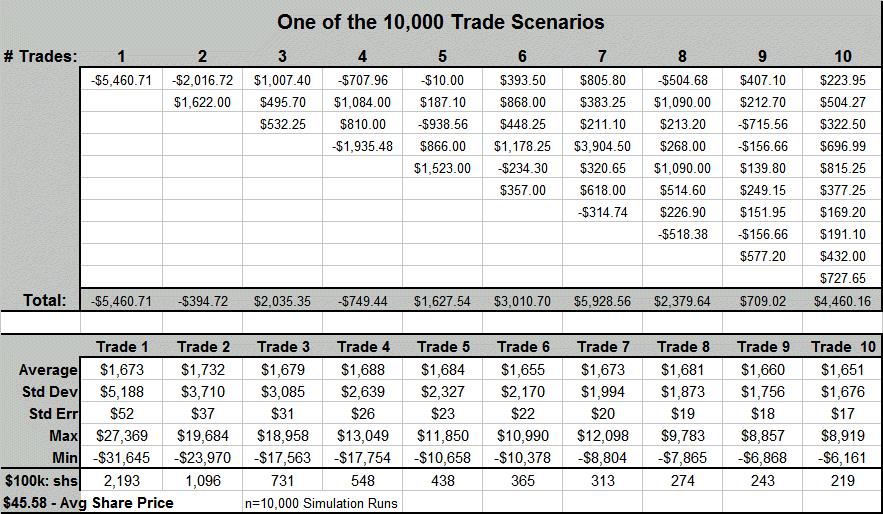
The following table charts one of the 10,000 trade scenarios where the single-trade strategy purchased 2,193 shares at the average stock price ($45.58) of the 734 trades, while the ten-trade strategy purchased 219 shares of each. The body of the table in the top half shows the outcome from each trade grouping. In this instance, the single trade lost $5,461, while the ten-position trade returned $4,460.
The bottom half of the table presents summary statistics for the 10,000 sets of trades, and three observations are obvious: (1) the mean gain for the $100k account is essentially the same whether it’s all put in single trades or diversified through multiple trades; (2) the variation (standard deviation and standard error estimates), however, depends on the number of trades; and (3) the extreme (MIN/MAX) points likewise depend on the number of trades. The last point means that big trade wins, as well as losses, are inversely related to the number of trades, i.e., the lower the number, the greater the chance to win or lose big.
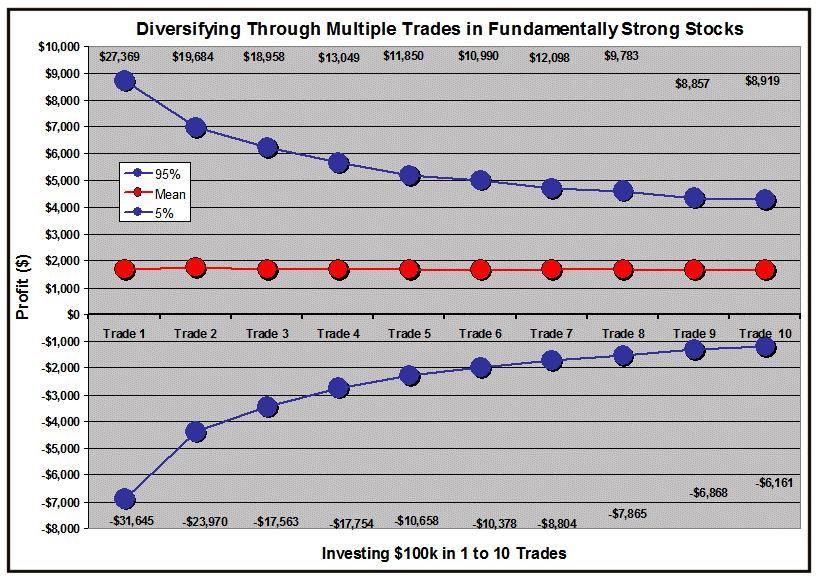
Finally, this last chart shows the 5%, the mean and the 95% points for each trade strategy’s distribution over the 10,000 trades. While the line of means remains the same, the outer limits narrow from left to right. This narrowing is a measure of risk. If my fundamentals-based trade strategy is to trade single positions, I could expect to lose from $7k to $31.6k in 5% (or one of twenty) of my trades. On the other hand, if I were to split my $100k account into 10 trades, 5% of the time I could expect to lose significantly less, between $1,200 and $6,161. Diversifying through the number of shares in a trade allows a trader to control his risk. I routinely, divide my account into 13 trades. The message that I want to leave you with: When you have a successful trading strategy, it’s far more important to control risk around a positive return then go for the big win and just as often experience the big loss.
Now that you’ve learned how to minimize risk through controlling your trade
size, why not see what else position sizing can do? Studies have shown that position sizing can also control the size of your account drawdown. How? Richard Miller explains more in Part 2, click here.
Richard Miller, Ph.D. – Statistics Professional, is the president of TripleScreenMethod.com and PensacolaProcessOptimizaton.com.


