Controlling Risk in Short-Term Trading: Part 2, Reducing DrawDown
In part I of this series (“Controlling Risk in Short-Term Trading “), I pointed out that even good trading strategies experience runs of losses; however, this risk can be minimized by proper position sizing, i.e., by dividing your capital into five or more positions at one time rather than fewer.
I concluded: “When you have a successful trading strategy, it’s far more important to control risk around a positive return then go for the big win and just as often experience the devastating loss.” Here, I’ll extend that argument and demonstrate through simulation studies that position sizing also controls the size of your account drawdown.
First, let’s look a little further at some of the particulars of trading risk. A strategy that’s profitable 70 percent of the time in a sequence of 174 trades (perhaps a year’s trading), can expect to experience five losses in any seven trades 4.32 times on average, six losses in seven trades 0.65 times and seven consecutive losses 0.05 times (or once in 20 years). Clearly, even good trading strategies experience strings of losses that put your account at risk if you’re not careful.
Let’s begin with the trading strategy itself before going deeper into the importance of position sizing. Simply put, TripleScreenMethod (TSM) crosses a number of fundamental screens against two-year PEG ratios to identify those 50-70 stocks weekly—from a universe of over 6,000–that are both fundamentally sound and have value remaining at their current price. Technically, TSM then concentrates on buying weakness and selling strength by entering long quality pullbacks to major areas of support, grading the quality of each by their TradingMarkets’ PowerRatings and 2-period RSI values. For further info on the strategies, see my articles: “How I Apply Connors’ RSI(2) to Trading Pullbacks” (9/29/09), “Trading Pullbacks in Wall Street’s Best Stocks” (7/21/09) and “How I Trade Using Both PowerRatings and Fundamentals” (5/21/09).
In 2009, TSM forecast 174 such trades: 123 winners (70.7%) averaging a 1.70% positive return but with 14 trades experiencing more than a 5% loss (-14.36% being the largest). Overall TSM’s hypothetical equity account would have experienced a 19.67% drawdown with the largest lasting 17 trades. If its position sizing strategy had been all in with every trade, a $100k account would have grown to $1,634,978 by the end of the year. Though hindsight is always 20-20 and 2009 would have been a spectacular year traded that way, in the real world, we worry about the trade risk that would be associated with going all in with every trade.
So we’re all on the same page, consider another sizing option. The same trading system but sizing each trade at 10% of the account’s equity–rather than the 100%– would have led to the same return; it just would have taken longer (10 years to be exact). That is, the same 174 single trades would become17.4 ten-trade groupings, each returning 1.7% on average, and looked at another way; the account would have turned over 17.4 during the year. Of course, another alternative would have been to find 1,740 trades during the year.
Given the TSM trading strategy and its 2009 performance, the question I want to answer here is this: How would position sizing be expected to impact the drawdown in its equity account? Or more simply, how would the drawdown change if each position was all in versus a sizing strategy that put 10 or 20% of the account in each position?

To assess the differences in their risk profiles, I used a well known statistical technique called Resampling or Bootstrapping. It harnesses the power of the computer to answer many types of statistical questions. In the case at hand, I make the assumption that the trading strategy (buying weakness in quality stocks and selling strength) is independent of trade sequence, i.e., another year like 2009 could be expected to produce a similar average return through the sequencing of individual trade returns would be different. This assumption allows me to use a given pool of trades to establish limits for a trading strategy: things like average return, loss probabilities, and account drawdown characteristics.
The return percentages for the 174 trades formed a sample pool that was randomly resampled 174 times with replacement to simulate a year’s trading: like drawing one of the 174 trade returns from a hat, recording its value and then returning that trade to the hat before drawing another one. The computer can create 1,000 such simulated years, each unique, in a few seconds. Then, these 1,000 simulated years can be used to assess trade statistics like the average of the 1,000 maximum drawdowns as well as their average trade lengths. Chart I shows the equity curves for 10 such simulated years, as well as the actual 2009 trade data (solid blue), for the sizing strategy of going all in on each trade.
Chart II similarly shows ten equity curves that resulted from 10% position sizing over 1,740 trades (10 years of 174 trades per year). The arrow shows where the account would be after the first year of trading these 10-position groupings, i.e., after the account had turned over 17.4 times during the year (rather than174 times). Note the reduced variability in the profiles relative to the Chart I data.

Table I provides summary statistics for 1,000 year simulations where position sizing was all in for each of the 174 individual trades (n=1), was 20% in each of five trades per grouping (n=5 and 174 trade groupings executed 870 individual trades), was 10% in each of ten trades per grouping (n=10 and 174 trade groupings executed 1,740 individual trades). The average return for each trade grouping is the same 1.70%; the percentage of winners improves from 70.7% to 90.6% as trade grouping size increases; the average final account balance is nearly the same at ~$1.88 million, though the Min/Max limits narrowed as the trade grouping size increased; finally, the average drawdown percentage decreased from 20.7% (n=1) to 2.3% (n=10) as did the average number of trade groupings within the Max drawdown period from 19.5 to 3.1.
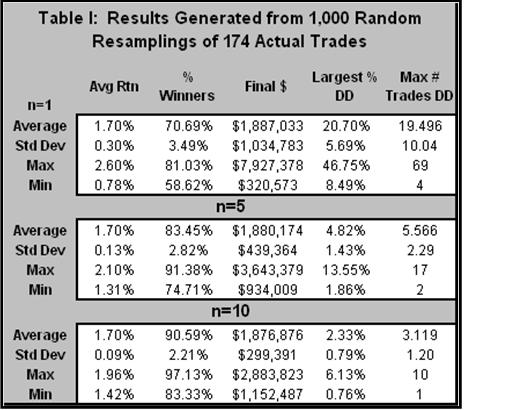
In summary, the risk associated with a good trading strategy, as measured by largest drawdown percentage and number of trade groupings within that drawdown, can be reduced substantially by reducing position size. While one sleeps better at night, the cost is that one doesn’t compound the return on his or her account as frequently so it grows more slowly. But then again, not every year will perform like 2009.
Richard Miller, Ph.D. – Statistics Professional, is the president of TripleScreenMethod.com and PensacolaProcessOptimizaton.com.
Backtested on over 17,000 trades test this new trading indicator for Leveraged ETFs and find high probability setups daily – click here now.