Controlling Trade Risk with Position Sizing
I wrote an article recently entitled Buying Weakness and Selling Strength that detailed a trading strategy using the 2-period RSI as buying (2 closes below 15) and selling (close above 80) triggers to enter TSM stocks that are characterized as having quality fundamentals and remaining value at its current price.
Click here to learn exactly how you can maximize your returns with our new 2-Period RSI Stock Strategy Guidebook. Included are dozens of high-performing, fully quantified stocks strategy variations based around the 2-period RSI.
When one starts uses the RSI exit, the first question that comes to mind is: Am I at more risk to a big loss without the traditional static stop loss point? Bear in mind, this RSI exit is a dynamic trigger, i.e., the only way to exit the TSM trade (profit or loss) is at the current day’s close or next day’s open following a 2-period RSI>80 close. In this article, I’ll show how position sizing can be used to control risk.
Consider, for instance, 2008, a very bad year for the markets where the S&P lost 38.5% of its value. Even so, trading quality stocks in pullback (buying weakness and selling strength) worked. As I cite in the above article, the RSI strategy produced 80% winners with an average 1.6 point gain (per share, per trade). Chart I shows the distribution of points gained (green) and lost (red) for these 101 trades. Rules defining the trade strategy can be found in the earlier article.
Figure 1:

While the strategy is sound, one needs to understand its draw-down characteristics before actually trading the strategy. You have to know whether you can sleep soundly at night or not when experiencing a trade like the one generating a $10 loss at the extreme left side of the chart.
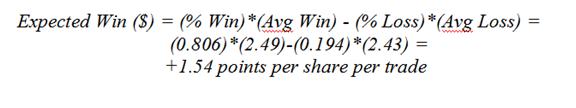
Here are some of the important statistics for this series of trades: average draw down was 6.7% during the life of the average trade (using intra-day lows); the average trade life was 6.6 days; the win rate was 80.6%; the average loss was 2.43 points; and the average win generated 2.49 points. Putting all this together, one can expect to win:
Figure 2:
Great strategy, but let’s now consider the draw-down risk. If I were to use a static stop loss (say IBD’s 7%), this strategy’s return would be far less as many of these trades fell below that limit before rebounding to a profit. That’s true, by the way, nearly always using strategies protected by a static stop loss.
Instead, consider position sizing as a technique to control risk or the size of your draw down for the 19.4% of the time these trades go against you.
Say you want to put 30% of your portfolio into this strategy (whether your portfolio is $10k, $100k or $1 million). You have the option of building a single position or dividing the 30% into multiple positions, for purposes of illustration here, say 10 positions. The strategy’s draw-down risk for the entire portfolio is the important number, and Monte Carlo simulation can be used to assess that risk (something easily done in Excel).
In this instance, one gathers a sampling of historical trade results for a strategy, ideally covering both good and bad periods. The sampling should be large enough to characterize the strategy’s expected performance under the current market’s condition. This could be as few as 50 or as many as thousands. It doesn’t matter so long as you feel it demonstrates typical results for the strategy as you’re trading it in the current market. In a current market scenario, one might use the last 50 trades then update the analysis with additional data as more trades are made (say every 50 trades).
This group of historical trade information forms a pool of results that can then be re-sampled randomly thousands of times with replacement. For example, say your pool consisted of just three trades: +1, +3 and -10 points. Re-sampling would randomly pull data from this group to generate a string of trades and a re-sampled data set. For example, this string of 10 trades might be randomly chosen: -10, -10, +1, -10, +3, +3, +3, -10, +1, +1. This string of trades—likely to be produced by our strategy—can then be used to characterize the expected draw down derived from varying position size, i.e., for putting all the money allotted for this strategy in just one trade at a time, in two trades (50% in each) at a time up to our limit of 10 trades (10% in each) at a time.
For purposes here, I’ll consider my pool of trades to be the 101 TSM trades in the 2008 market (distribution of results shown in Chart I). Re-sampling these 101 trades into 1,000 groupings of 1 through 10 trades (position sizing of 100% to 10% per portfolio trade) produces the results in the following table. For example, the N=1 trade sizing averaged returning 1.62 points per trade but experienced the extremes of a minimum return of -21.92 points and a maximum return of 16.21% (the 3.33 standard deviation documents the variability of this position sizing on returns).
Contrast these characteristics with the other extreme where 10% of our allotted cash was put into each of 10 positions. While the average return is slightly lower at 1.53 points per trade, both the variation and extreme limits are much reduced.
Figure 3:
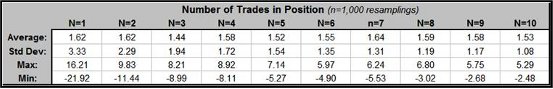
Figure 4:

Chart II summarizes how portfolio risk can be expected to change with the number of positions comprising the portfolio. The red line is the 1.44-1.64 point average from 1 to 10 positions per portfolio; the blue lines are the 1%/99% confidence limits; and the green lines are the 5%/95% confidence lines. For example, if 30% of the portfolio went into 2 TSM trades, I could expect a -7.5 points loss (average for the 2 individual trades) or as much as -21.92 points once in 100 trade groupings. Conversely, one could expect to gain an average 12 to 16.21 points once in 100 trade groupings, too. Now, if I divided the 30% into groupings of 10 TSM trades, I could expect a far smaller average loss (-1 to -2.48 points loss once in 100 trade groupings), but also, a much smaller average gain (4.1 points or greater gain once in 100 trade groupings). There it is, good trading strategy utilizing position sizing to minimize risk.
Example of Controlling Risk by Position Sizing
As an example, assume a $100,000 account that devotes 30% ($30,000) to trading TSM stocks. For calculation purposes, assume, too, that the stocks being traded are $40 stocks. Trader one puts his money in 375 shares of two stocks ($15,000 in each). On average, he can expect to make $1,215 (2 x 1.62 x 375) or 4.05% on his $30,000 every 6.5 days (if a new group of stocks were ready to trade that often); however, once in 100 trades of these type pairs, he can expect to lose at least $5,625 (2 x 7.5 x 375) or a 18.75% loss–perhaps on the very first trade he makes. True, once in 100 trades, he can expect to profit by $12 points and win $9,000 or a 30% gain. Personally, I want less variation and less down-side risk in my returns.
Again, contrast the 2-position approach with a 10-position approach. Trader two puts her money in 75 shares of ten stocks ($3,000 in each). Again, on average, she can expect to make nearly the same or $1,148 (10 x 1.53 x 75) on her $30,000 every 6.5 days (again, if new trades are available on that frequency). Now, once in 100 trades of these 10-position trades, she can expect to lose at least $750 (10 x 1 x 75) or 2.5% or make $3,075 (10 x 4.1 x 75) or 10.25%. Using position sizing to mitigate risk, this trading strategy experiences far less downside, upside and variation. It just makes money steadily.
My trading platform (Tradestation) costs me $1 per 100 shares or option contract in commission so the difference in the two approaches describe above is small. If you’re using a broker that charges a fee by the trade, your commissions would be substantially larger, and you might want to consider a broker that offers a commission structure similar to mine (with even a $10,000 account, though you might have to ask for it).
Richard Miller, Ph.D. – Statistics Professional, is the president of TripleScreenMethod.com and PensacolaProcessOptimizaton.com.
Do you trade FAS, FAZ, SSO, SDS, TZA or TNA? Introducing Leveraged ETF PowerRatings, a simple but powerful rating system for Leveraged ETFs. Click here to see today’s ratings.