Crowd Psychology And Herd Mentality
What Friday’s Action Tells
You
It was, to say the least, quite a week. The
economic news was inflation on Monday, moderate inflation and measured
interest
rate moves along with increased productivity from the FOMC on Tuesday, and
then
full-fledged recession fear set in on Wednesday. Crowd psychology, herd
mentality and fear set in, in addition to option expiration and the 04/14 –
04/15 time dates, with the end result being a mini meltdown that saw the
(
SPY |
Quote |
Chart |
News |
PowerRating) decline -4.1% from the 119.06 3:35 p.m. ET bar on Tuesday to the
114.15 close on Friday. The SPX
(
$SPX.X |
Quote |
Chart |
News |
PowerRating) closed the week below its
longer-term moving averages at 1142.62, -3.3% on the week and -1.7% on
Friday.
The Dow
(
$INDU |
Quote |
Chart |
News |
PowerRating) ended the week at 10,088, -1.9% on Friday and -3.6%
for
the week.
Crude oil traded below $50 which sent the
(
OIH |
Quote |
Chart |
News |
PowerRating) down -7.0% on the week and will no doubt provide short-term and
intraday traders with many more good setups. After the portfolio herd
cleanses
their fear, the buyers will return. In classic recession-hype response, the
(
CYC |
Quote |
Chart |
News |
PowerRating) was -6.9% on the week and the XLB (basic industry SPDR) -8.3%. The
XLB
decline extended it down to the -3.0 standard deviation zone (three-month
period) as the herd all fought to get out of the game at the same time. Some
of
that money, as expected, rotated to the defensive issues, with the
(
PPH |
Quote |
Chart |
News |
PowerRating)
+3.3%, in addition to some other consumer staples.
Interest rates declined along with crude oil,
while the
(
TLT |
Quote |
Chart |
News |
PowerRating) was +2.5%. The XAU was -7.2% and the $HUI (AMEX Gold
index)
is now -21% since 03/09 following the SPX RST top at 1229.11. On the other
side
of that is the US Dollar index ($USD) which had advanced about 5.0% since
the
SPX 1229.11 rally high and about +6.0% off the 80.39 low in late December
2004.
On top of all the sector rotation in the three-day implosion, there was an
option expiration. This resulted in NYSE volume of 2.2 billion shares on
Friday,
with a volume ratio of 16 and breadth -1715. The 3 MA of the volume ratio is
extremely short-term oversold at 18 with the 4 MA at 30. The 3 MA of breadth
is
-1614 and the 4 MA -1038.
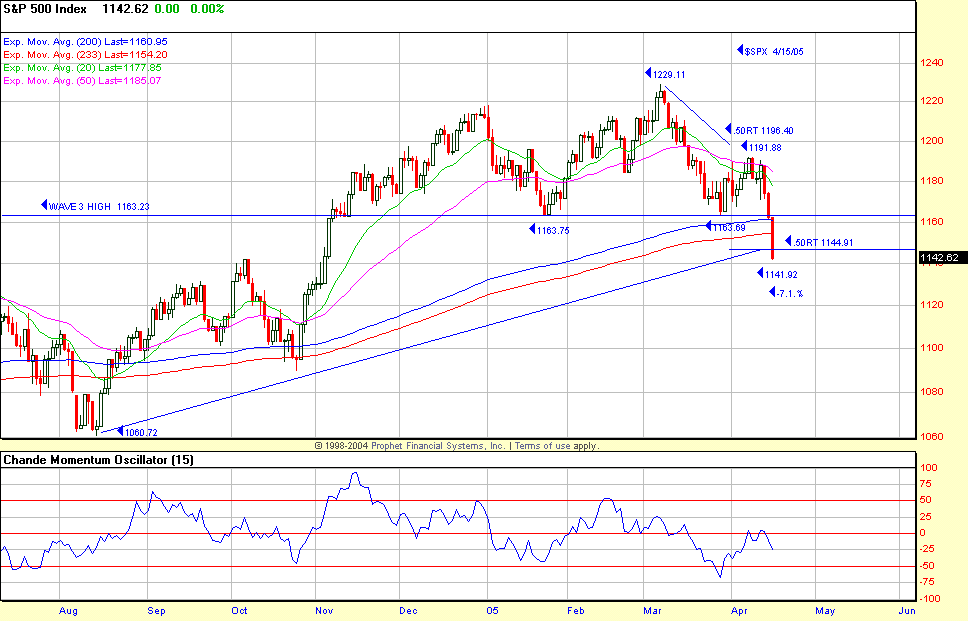
Friday’s meltdown saw the SPY trade through
the
116 – 115 longer-term EMA zone, closing at 114.15. That same zone for the
SPX is
1161 – 1153 with the 1142.62 close. The .50 retracement to the August low is
1144.92. The SPY .50 retracement to the August 105.83 low is 114.54. The
three-month standard deviation band is about 113.50. With this emotion and
price
extended to almost the -3.0 standard deviation bands for the SPY and
(
DIA |
Quote |
Chart |
News |
PowerRating),
traders will get good intraday reversal setups this week at extended levels,
and
they must be taken regardless of what your longer-term opinion is. As for
that,
you have been aware of the 2005 first-quarter time zone for quite some time
and
the elevated time risk off the October 2002 bottom. I refer you to the last
commentary regarding that subject which is the
March 28 commentary:
“Regarding the
longer-term
cycle, my views haven’t changed. I expected this bull cycle to last 2.15 –
2.5
years with the fifth leg measurement highest probability zone at 1254 –
1305.
The initial selling plan was started in the 1220 – 1230 (Inner Circle) zone
on a
scale-up unit basis. The time factor right now from the October 2002 769 SPX
bear market low is 128 weeks, or 2.46 years. The SPX March 2000 – October
2002
bear market move was 133 weeks, or 2.5 years, and for the Dow it was 143
weeks,
or 2.7 years. There is very little chance that this will develop into any
kind
of a parabolic upside market, so time is wasting, but hopefully this fifth
leg
will reach the measurement zone. If not, there is a Plan B. Do you have
one?”
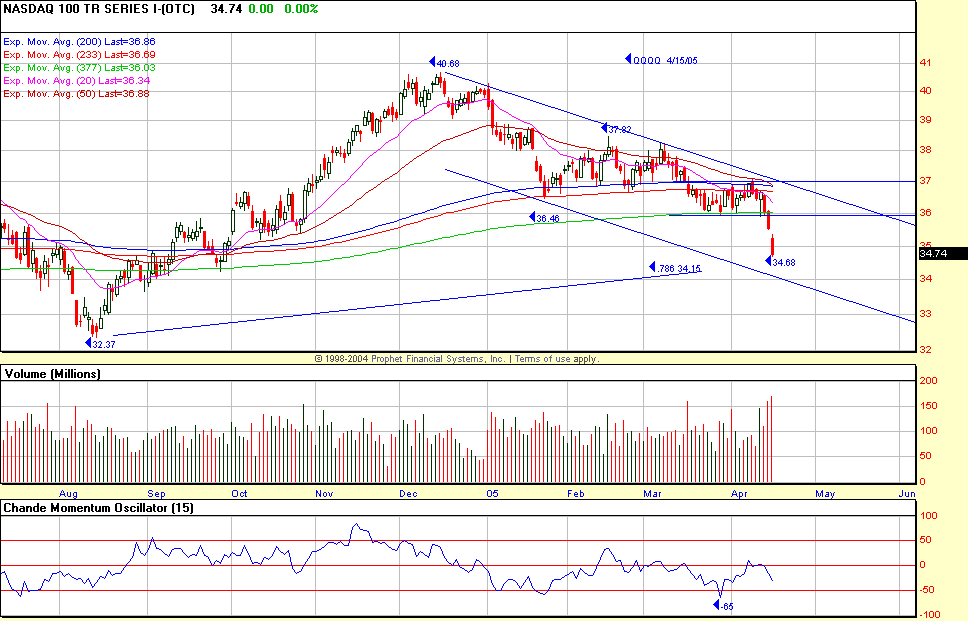
There was record volume in the index proxies
with
the SPY breaking the longer-term moving averages with lots of hedging being
put
on against longer-term positions. The
(
QQQQ |
Quote |
Chart |
News |
PowerRating) traded 159 million and 170
million shares on Thursday and Friday as price broke a 20-day trading range
and
also the 377-day EMA at 36.03, the 233-day EMA at 36.69 and 200-day EMA at
36.80. The .786 retracement to the August low is 34.15, which coincides with
the
downward channel and -2.0 three-month standard deviation band, so expect
reflex
attempts from this zone, but also expect strong resistance on a rally back
to 36
after all of this downside volume on Thursday and Friday (see chart). The
same
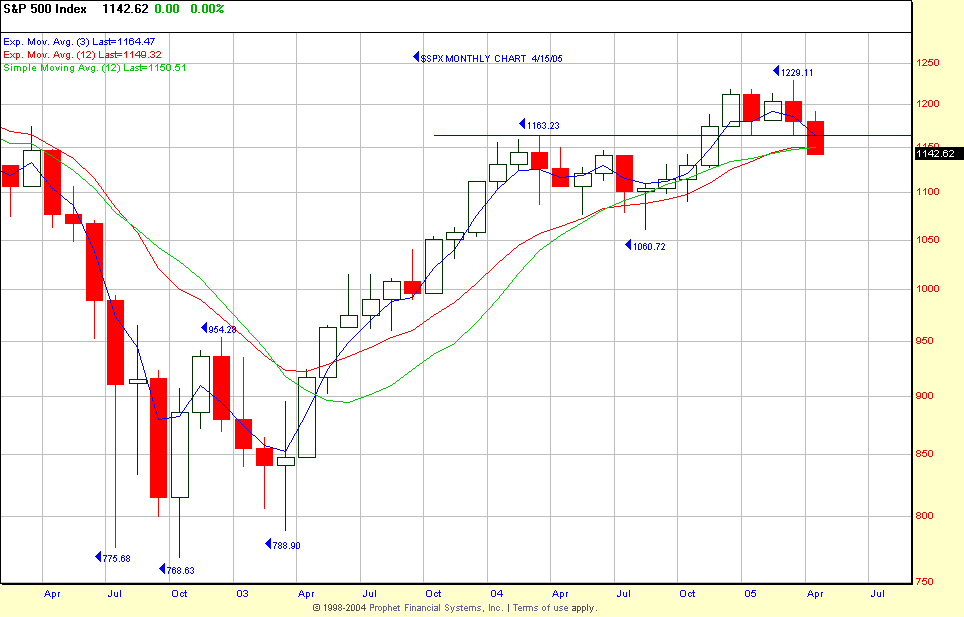
holds true for the SPX at the 1154Â – 1164 zone (see SPX chart). The
early
focus this week on any reflex is the 12-month EMA and SMA at 1149.32 and
1150.51. Nothing good happens unless the game is played above the 12-month
lines, or else there is more significant downside in price.
Have a good trading day,
Kevin Haggerty
P.S. I will be
referring to some charts here:
www.thechartstore.com in the future.


