CSCO Fire Drill
The
extremely light volume ending in
inside days for both the Nasdaq 100
(
NDX |
Quote |
Chart |
News |
PowerRating) and S&P 500
(
SPX |
Quote |
Chart |
News |
PowerRating) told us
nothing. The NDX kept its string of 3% or greater moves, finishing -3.7% led by
the SOX (-3.5%). No surprise there after the recent move. The
SPX pushed at -0.3% and the Dow was +0.3%.
With all this volatility,
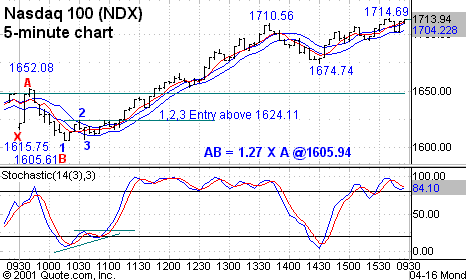
the NDX continues to trade geometrically and give daytraders lay ups. If you framed
the NDX from the 1605.61 low on 4/12/01 to the 1714.46 high the same day, you
were presented with three good trading opportunities yesterday at key alert
zones.
Instead of me doing it for
you today, what say you do it and I give you the answer in tomorrow’s text with
a chart example? Pretend you are at my seminar. In
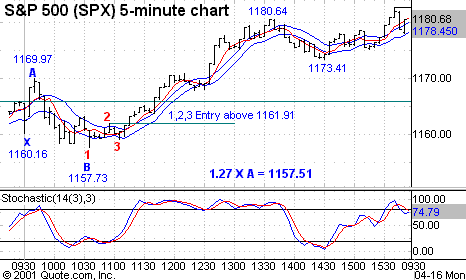
today’s text, I have included the NDX and SPX charts from 4/12/01, highlighting
the extension bottoms with 1,2,3 entries.Â
After the close yesterday,
the new fire drill for the week started with Cisco’s warning. Again. The NDX
futures were 1663 at 4:00 p.m. and lost 43 points in one bar to a 1620 low on
that 4:05 p.m. bar. As you know, it doesn’t take much to move them.
(
CSCO |
Quote |
Chart |
News |
PowerRating)
immediately traded below 16.Â
At 6:30 a.m. this morning,
the S&Ps were -12 and the NDX futures -42 and trading at 1586. The media is
at high speed this morning between CSCO and the economic numbers they love to
babble about but never return to them as they get revised.Â
Nevertheless, daytraders
almost always get to capitalize on the one-shot volatility plays they create,
along with the retail emotion and program trading. It
is still most profitable fading the emotion both ways.
Today the first part of the
Trading Plan has our familiar Trap Doors and Volatility Bands and then you must
decide where to sell the retracements on any contra rallies. Yesterday’s
list has, in addition to the Semis, most of the names that are expected to
get whacked early on today.
|
(June
|
||
|
Fair Value
|
Buy
|
Sell
|
|
6.95
|
8.45Â |
 5.00Â
|
(
CIEN |
Quote |
Chart |
News |
PowerRating) had traded down
6 points when I checked the idiot box before I left for the office this morning.
FYI, when I do that, I leave the sound off and view the numbers so I don’t get
contaminated with the verbal dribble.Â
Hopefully the plug is
pulled big on the retail selling and the program traders do their thing this
morning, both of which sets the daytrader’s plate for the contra move. Your best
early longs will usually come from the stocks down the most, like the CIENs,
etc., and then those that have the best relative strength if they take them down
early.
Have
a good trading day.

Chart
1. Five-minute chart of S&P 500 (SPX) with
5-period EMA and
8-period (low and high) moving averages
on Thursday
April 12, 2001.
Â

Chart
2. Five-minute chart of Nasdaq 100 (NDX) with
5-period EMA and
8-period (low and high) moving averages on Thursday
April 12, 2001.
Â

Chart
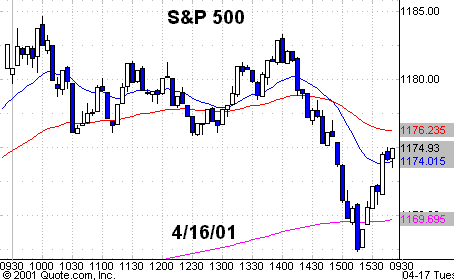
3. Five-minute chart of S&P 500 (SPX) with
20-, 50-
and 260-period EMAs.
Â

Chart
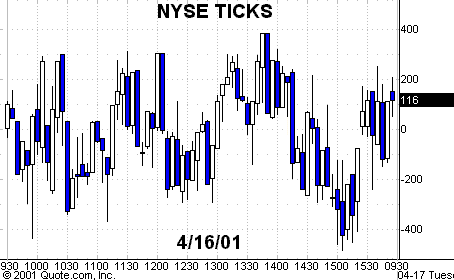
4. Five-minute chart of New York Stock Exchange Ticks.
Gary
Kaltbaum on TradingMarketsWorld! Gary Kaltbaum will be appearing on the
Intermediate-Term Trading board Thursday, April 19, at 8:00 p.m. ET. Be sure to take
this opportunity to chat with and have your questions answered by a leading
intermediate-term trader. Click
here to take your trading to a new dimension.
