Cup-and-Handle Trading Techniques For Swing Traders
The cup-and-handle is typically a major reversal pattern that often precedes large rallies.
It is formed when a stock sells off, bottoms, and then begins to rally, creating a “cup.”
After the rally, the stock drifts lower, forming the “handle” of the pattern (see Figure 1).
Before discussing cup-and-handle pattern trading techniques, we will dissect the
pattern itself and explain why it works. Later we will discuss how to use volume as a confirming indicator and offer suggestions about where to place your entry orders and protective stops.
Understanding the pattern
To better understand how cups-and-handles function, we will first analyze the market dynamics at work during the different stages of the pattern. After the initial sell-off is complete, the stock trades in a range as bottom-fishers attempt to buy on dips, and short sellers and short-term traders sell the stock as it tries to rally. The stock gradually begins to trade in a narrower range as the bulls and bears begin to agree on price.
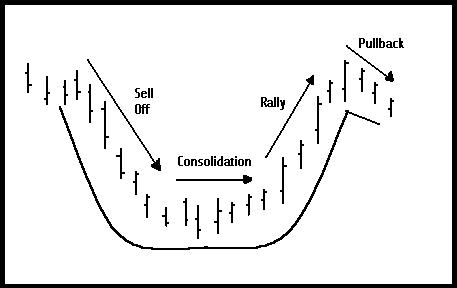 |
| Figure 1. Cup-and-handle pattern. The stock sells off, consolidates, rallies, and then pulls back. |
However, this equilibrium seldom lasts long. Breakout players start buying, trying to get an early jump on a possible new trend, creating the right side of the cup. When this rally approaches the level of the left side of the cup, traders who were lucky enough to buy during the consolidation or early in the breakout look to take profits, while those who were long before the decline try to get out at break-even. As a result, the market dips, forming the handle.
One note: According to William O’Neil, who popularized the pattern, the best cup-and-handle candidates are stocks that already have staged a strong rally, preferably ones that have doubled in price. This means the left side of the cup is actually a correction within a much larger move.
The duration and depth of the pattern
How long a cup-and-handle pattern should take to form is debatable. The good news is that both long- and short-term patterns tend to work well. I like to see the sell-off (the left side of the cup) take two to three weeks to form on a daily chart, followed by a three-to-six week base (the bottom of the cup), a two-to-three week rally (the right side of the cup), and a one-to-two week handle. I’ll consider much longer or shorter patterns if there are other reasons for owning the stock.
Similarly, the depth of the cup is also subject to debate. In general, I like to see the bottom of the cup at least 20 percent but no more than 40 percent below the top of the left side of the cup. For example, if the top of the left side of the cup was $100, the bottom of the cup should be somewhere between $60 (40 percent) to $80 (20 percent).
The overall market climate also impacts how deep the pattern needs to be. Generally,
I tend to look for shallower cups in bull markets, and somewhat deeper cups in bear markets or sharp corrections. Basically, the stock’s behavior should be in line with the
overall market.
Handles
Although I am fairly flexible about the requirements for most elements of the pattern, I am more strict when it comes to the handle. Essentially, I treat the right side of the pattern like a pullback, which means it should retrace 5-15% of the stock’s price. Some traders measure the depth of the handle relative to the depth of the right side of the cup. Using this standard, I would ignore any handle that retraces more than 30% of the right-side rally (see Figure 2). When a handle becomes too deep, it negates the larger pattern and may actually be the beginning of a new downtrend.
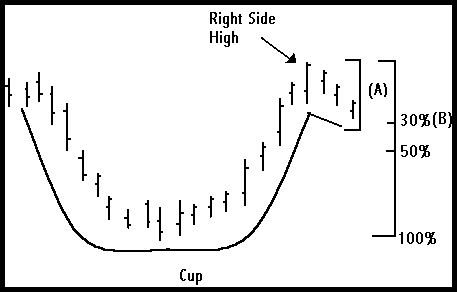 |
| Figure 2. Depth of handles. Ideally, the handle (A) should pull back no more than 5 – 15% off the stock’s high or no more than 30 percent of the rally off of the base of the cup. Deep handles negate the pattern and may suggest a new downtrend. |
Volume
Although it is not a requirement, a cup-and-handle pattern accompanied by a similar pattern in volume is more desirable than one that is not. Ideally, volume should increase dramatically while the left side of the cup is forming, as traders panic and dump their stock. Volume should decrease as the bottom of the cup forms and traders begin to agree on price and the market consolidates.
Volume should increase once again during the breakout of the base and the formation of the right side of the cup, fueling the rally. Finally, volume should taper off during the formation of the handle as profit-taking occurs. Heavy volume during the handle formation, by contrast, may suggest that more than just normal profit-taking is taking place.
While volume can help confirm a cup-and-handle pattern, the price pattern itself
is more important. Do not rule out a pattern simply because volume does not mimic the
price action.
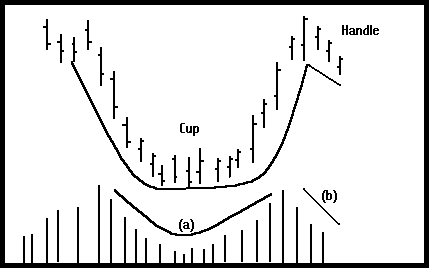 |
| Figure 3. Ideally, volume should mirror the cup-and-handle pattern in the price series. Notice how the volume decreases in middle of the cup, increases during the breakout of the cup (A), and decreases during the formation of the handle. |
Trading the pattern
Because the right side of the pattern is essentially a pullback, I tend to trade the pattern as such (for more information on this subject, see the article titled “Trading pullbacks” in the Trader’s Learning Section of TRADEMARKETS.COM). Once I’ve identified the handle, I’ll place my order slightly above the market–above a two- or three-day high, for example. If filled, I’ll place a protective stop no lower than the bottom of the handle. This ensures I will be stopped out with a minimal loss if the handle fails.
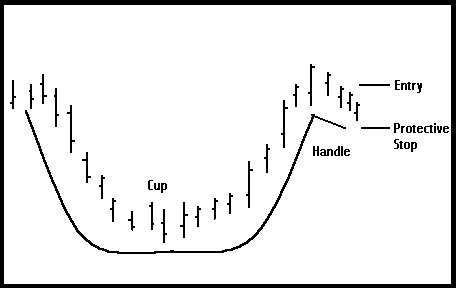 |
| Figure 4. Entries and protective stops. Enter above the market so the stock has already pivoted back into the direction of the uptrend. The pattern is negated if the stock drops below the handle, so place a protective stop slightly below the bottom of the handle. |
Figures 5 through 7 provide a few additional examples of cup-and-handle patterns. A good way to familiarize yourself with the pattern is to look for past market rallies–many large run-ups are preceded by cup-and-handle patterns. TRADINGMARKETS.COM also provides a list of stocks forming cup-and-handle patterns, updated twice a week.
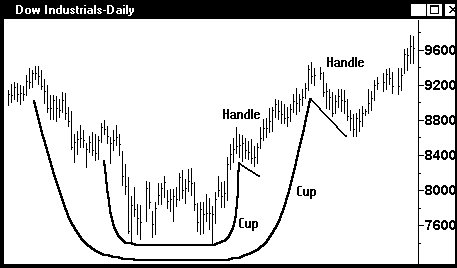 |
| Figure 5. Dow Jones Industrial Average (DJIA), daily. Notice the smaller cup-and-handle pattern is actually part of a much bigger cup-and-handle pattern. Source: Omega Research. |
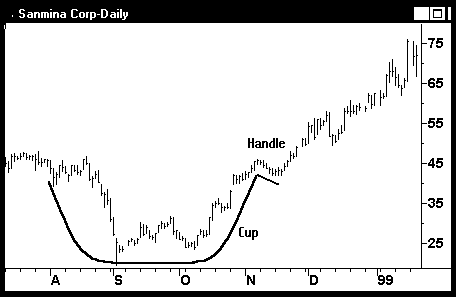 |
| Figure 6. Sanmina Corp (SANM). Technology stocks often make good candidates for cup-and-handle patterns because they go in and out of favor with investors. Source: Omega Research. |
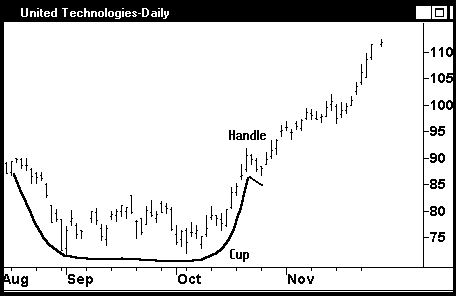 |
| Figure 7. United Technologies (UTX). Notice the handle was fairly shallow and only a few days in the making. Source: Omega Research. |
Summary
Although it is a discretionary pattern, the cup-and-handle offers the opportunity to capture large rallies. The pattern forms when a stock sells off (the left side of cup), consolidates (the bottom of the cup), rallies back to the original sell-off level (the right side of the cup), and finally pulls back (the handle). Volume can be used as a confirming indicator when the pattern has been recognized. Trading the pattern involves placing an entry order above the market when the handle is formed, and placing a protective stop beneath the handle.
Click here to go to the cup-and-handle list in the Stock Traders section.
<a
href=”https://tradingmarkets.comsubscriptions/details.cfm?item=5808&subcat=st”>Click
Here For A Free 1-Week Trial To Dave Landry’s Daily Swing Trading Alerts
<a
href=”https://tradingmarkets.comgalleria.site/main/landry/”>Click Here To Learn
How To Trade Dave Landry’s Best Strategies
