Current Market Inflection Point
From 1990 to 1997, Kevin Haggerty served as Senior Vice President for Equity Trading at Fidelity Capital Markets, Boston, a division of Fidelity Investments. He was responsible for all U.S. institutional Listed, OTC and Option trading in addition to all major Exchange Floor Executions. For a free trial to Kevin’s Daily Trading Report, please click here.
In 26 days, since the 4/26/10 1219.80 high versus the 1229 .618RT zone to 1576 from 667, the SPX has had a travel range of 37.7%. Welcome to the new Zimbabwe Exchange in the Republic of the USA.
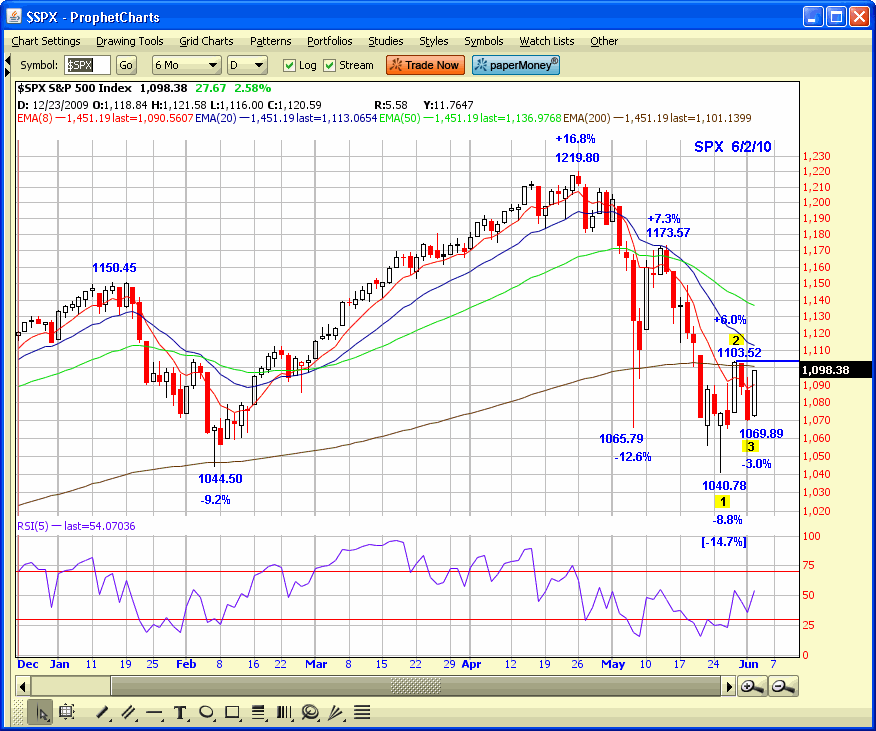
The SPX declined -14.7% to the 1040.78 low on legs of -12.6%, +7.3%, and then -8.8% down to the 1040.78 low. This was followed by the +6.0% leg to the 1103.52 high and 200DEMA zone, and then a -3.0% pullback to the 1069.89 low on Tuesday, followed by the +2.6% gain today to close at 1098.38 and on the high of the day.
The SPX .50RT to 1040.78 from 1103.52 is 1072.15 and that would qualify as a retest of 1040.78 if the SPX can take out the 1103.52 123 Higher Bottom trend entry high, with the 200DEMA at 1101.14. Technical traders will swing to the long side or at least hedge positions, and long term moving average market timing investment services will probably increase their equity allocation on the long side.
Tuesday was a -1.7% day for the SPX as the Euro made new 4 year lows versus the U.S. dollar and today it was trend up all day for the SPX to finish +2.6% at 1098.38. There was a “magic move” vertical spike starting on the 1081.03 2:20PM bar low to finish at 1098.38 sp. I am sure there was some significant program portfolio adjustments made.
The commodity sectors, especially energy had imploded the previous day with double digit declines, but stocks like HAL and BHI were +12.0% and +10.5% today as the commodity sectors provided the leadership. The OIH was -14.9% for the two previous days, for all the obvious reasons you hear 24/7, and it was +6.1% today with the XME +5.1%.
It was an excellent day for day traders because the SPX did not have a big gap up opening, and the 1st hour price action provided many of our defined strategy setups after which it went trend up all day. There were various contracted volatility setups to play during the advance in addition to SPX Flag B/O after the 2:20PM low which was the same for our focus list stocks like IBM, CAT, MMM and BA, just to name a few.
The Euro crisis will get worse, not better, but a technical bounce above 1103.52, and a time out for the Euro crisis could easily see the SPX run to the declining 50DEMA at 1137, or to the 1150 resistance zone. As the flight of capital from the Euro zone intensifies, the U.S. equity market could be an unsuspecting beneficiary, but in the meantime it is just the U.S. Dollar, Gold, and Treasuries that are the “safe haven” for this capital.

Have a good trading day!
Click here to find full details on Kevin’s courses including Trading with the Generals with over 20 hours of professional market strategies. And for a free trial to Kevin’s daily trading service, click here.
