Current market perspective
Kevin Haggerty is
the former head of trading for Fidelity Capital Markets. His column is
intended for more advanced traders. Kevin has trained thousands of traders
over the past decade. If you would like to be trained by him,
ext. 1
The best way to
catch up on my current market thoughts is to recap some excerpts
from the four commentaries before I left. I would also like to thank you all for
the many get well wishes I have received as they are greatly appreciated.
from the 9/20/05 commentary:
“This corner is very
pleased with the long synthetic straddle timing as the volatility swings have
already started. The chance of a significant down-move is clearly present
through October, however, if the major index levels can hold, the Generals will
have an opportunity to mark prices up with resulting new SPX highs and Wave 5
will enter a significant bull cycle ending measurement zone from 1254 -1305.
Either way, it is win-win for the strategy. There is significant long-term
Fibonacci ratio symmetry through October, so if you get frozen in the headlights
on the downside just look in the mirror for the reason. Longer-term cash index
proxy positions have, as you know from previous commentaries, already been taken
off the table and replaced with longer-term calls so bull cycle profits were
booked and the calls allow for a significant participation on any more upside
and a defined premium risk on the downside. Those calls have been supplemented
with synthetic straddles which can negate any loss of call premium on any
significant downside or upside moves. A prolonged period of low volatility would
be a negative because of time decay.”
from the 9/21/05 commentary:
“When you see how
the most economic sensitive sectors and groups are trading, you can see why
Greenspan might be nervous in thinking soft landing as he plays with the money
supply while raising short rates. Currently trading below their 200-day EMAs are
the XLB (basic materials), XLI (industrials), XLY (consumer discretionary), and
RTH (retail). The XLY made its bull-cycle high on 1/3/05 while the XLB, XLI and
Dow made their highs on 03/07/05. The RTH hit a new cycle high on 08/01/05.
Suffice to say, this market action is a heavy negative. Yesterday the RTH was
-2.1%, XLY -1.7%, and XLB -1.5%. The chemicals as a group yesterday were -2.00%
and are in their own bear market condition right now. Just look at Dupont
(DD),
Dow (DOW)
and Rohm & Haas (ROH)
to name a few. As a below-the-line group (BTL), daytraders have been
capitalizing on the short side.”
from the 9/22/05 commentary:
“There are some key time dates into next
week–the end of this third quarter. September 26 is 233 days from the 10/25/04
bottom. September 28 is 144 days from the 03/07/05 top and also 21 days from the
08/29 bottom. September 29 is the 1.618 ratio from the 07/07 – 08/29 bottoms.
September 30 is the 1.272 ratio of the 12/15/04 top to the 08/03/05 top. Today
is also the 2.0 ratio from the 04/20/05 – 07/07/05 bottoms.
Suffice to say, there will be volatility and
opportunity into next week. I would imagine the Plunge Protection Team is ready
to step in and stabilize should there be a downside air pocket accelerated by
this new hurricane and the heavy media news. The Generals certainly want the SPX
to close at a minimum above the 12/31/04 close of 1211.92. As we enter this
short-term oversold zone, only index proxies should be carried overnight,
provided the initial day trade closes with a decent profit cushion.”
from the 9/23/05 commentary:
“This will be my last
commentary for a few weeks, but my thoughts on this September/October period are
outlined in the previous 2-3 commentaries, in addition to what this corner has
done with the long term index proxy positions. Quick, short-term extended
over-reactions continue to be daytrader friendly and will be throughout this
period. Do your own work, because there is way too much subjective market
commentary out there to confuse you. Refrain from reacting in the same direction
as obvious news and let price and internals confirm your levels in conjunction
with the primary tools that many of you have learned in
previous seminars and the
Sequence Trading module.”
Today’s Commentary
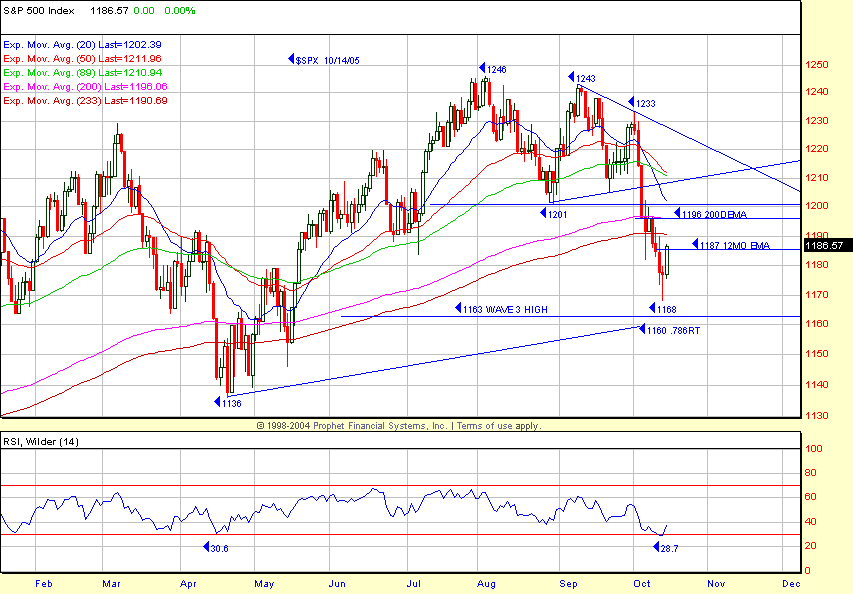
The SPX closed on Friday 09/30, at 1229, with at
1230 intraday high. Monday, October 3, had a 1233 intraday high and 1227 close
and from there it was eight days down and -5.3% to Thursday (10/13) 1168 low.
09/30/05 had Fibonacci ratio symmetry back to the 10/02 low and Inner Circle
members received the email with the explanation of the numbers in the 09/26
email. The SPX decline to the SPX 1168 low took out the 1201 08/30 swing point
low, 1196 200-day EMA, 1191 233-day EMA and the 1187 12-month EMA (see chart).
This zone now becomes major resistance and will attract more selling on the
first retracement to these levels. Based on various momentum indicators, the
1168 low put the SPX oversold condition on a level similar to 08/04 and 04/05.
The SPX was the most oversold of the major indices. The 4 MA of the volume ratio
was 30 on 10/13 and that was also the 6 MA. The 4 MA of breadth was -1273 with
the 5 RSI at 14 and the 14 RSI less than 30. More importantly, the SPX had
extended down to the 3-month, -3.0 standard deviation zone, while the DIA and
QQQQ were at their -2.0 zones. There was a significant increase in program
trading, which put even more pressure on the SPX above and beyond the normal
institutional selling. A reversal on Friday to the 1186.57 close, +0.8%, was an
RST entry above 1179.56, which was confirmed by the $VIX RST sell reversal below
15.98, the low of the 17.19 high day. The SPX RST long entry above 1179.56 was
played only as a day trade with 50% carried overnight because of the 7-point
profit cushion into the 1186.57 close. I do expect more selling on any oversold
reflex into the resistance. The Dow closed at 10,289 with range resistance at
10,350 and the 233/200 EMA zone, from 10,443 – 10,460.
The SPX decline to 1168 put all of the sector
SPDRs except the XLE, XAU and XLU below their 12-month EMAs, so anticipate the
resistance sell zone using a combination of the 12-month EMA, 40-week EMA, and
233/200-day EMA. You can do the same for the component stocks. There is now a
much smaller universe of ATL (above the line) stocks, but there are some, so
make sure you identify them for your daytading focus list. There are now many
BTL (below the line) stocks, so they become your short-side focus list into
resistance. Do the work–it will pay off in spades.
The bottom line is that by my not being in front
of a screen since 09/27 and having the long synthetic straddle position put on
between SPX 1230 – 1240, it has been very profitable not being here; however,
the key to that is the logic as to why they were put on, which made the trade.
Dynamics makes the trade, not the pattern itself.
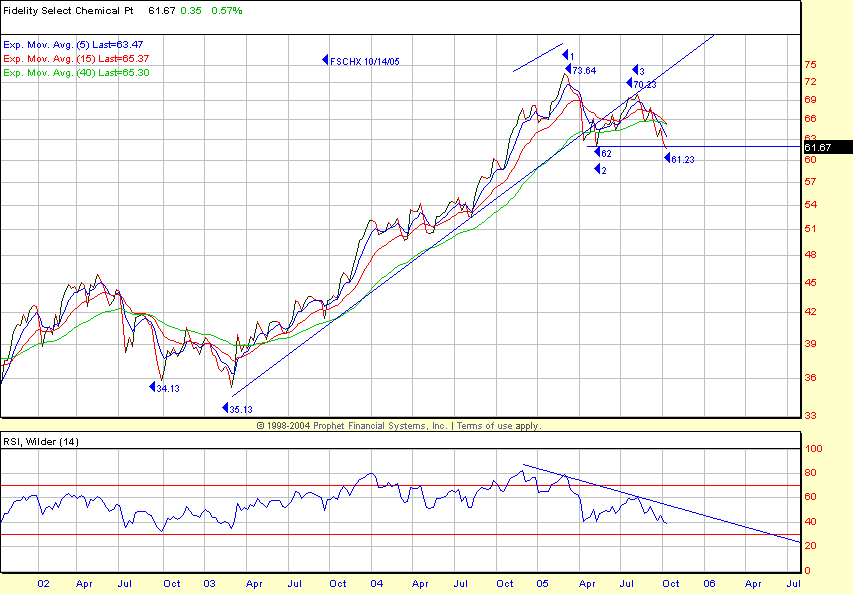
In addition to the XLB, which has a 55% chemical
component, I watch the Fidelity Select Chemical Fund (FSCHX) when assessing
institutional reaction to the current economy. As you can see on the chart, the
FSCHX advanced +116% from the 10/02 low, topping out at 73.64 in 03/05 as did
the Dow and XLB. The XLY (consumer discretionary SPDR) peaked in 12/04 at 35.46
after a +73% bull cycle gain. It sure as hell beats the media/brokerage
firm economic hype that you get inundated with every day.
You should some more SPX upside reflex from the oversold condition, but this
current air pocket scared many players and that will bring some more selling
when price reaches the major resistance.
Have a good trading day,
Kevin Haggerty


