Current Market Perspective
The SPX has spent the
past 11 days at and below the longer-term moving average levels, with
the 200-day EMA at 1160 and 233-day EMA, 1154. There is also primary resistance
with the head and shoulder neckline at 1163.50 -1165, and this has stopped each
rally attempt so far.
The current decline put both the RSI 5 and RSI 14
in oversold territory with a time zone fast approaching. That’s a positive.
Regardless of what the Fed says/does with short-term interest rates, the
business cycle has turned over and is pointed down. I also see that the Fed has
pumped some liquidity (money supply) into the system, so that could help boost a
short-term index rally from the current oversold zone.
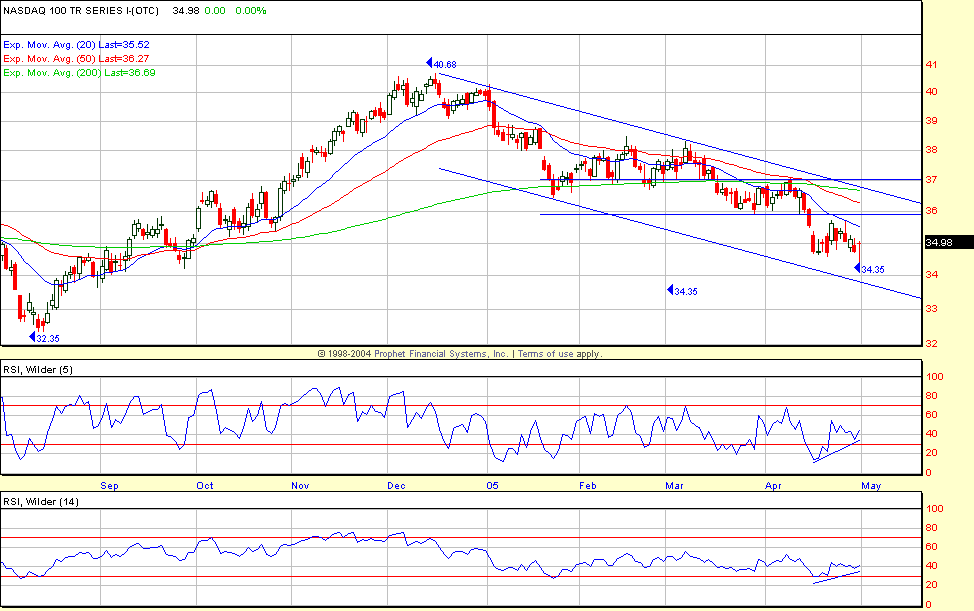
The QQQQ and Nasdaq are in bear markets as
defined by our monthly, weekly and daily guidelines. The 12-month EMA/SMAs are
rolling over (36.38 and 36.70) and the QQQQ closed at 34.98 on Friday, having
made a 34.35 recent low
The weekly method we use with the 5, 15 and 40
week EMAs is in full negative mode with all three EMAs declining, with the 5 <
15 < 40. The retracement short level is between the 15-week, 36.44 and 40-week,
36.64 EMAs. The QQQ has advanced +106% to 40.68 and was -16% to 34.35. the wave
4 low is 32.35 and there are no key price zones until 30.22 -29.95. Thirty would
be a -26% decline and a .24% retracement of the bull move and also the .618
retracement to the 23.32 retracement low, which was the 1,2,3 higher bottom to
the October 2002 17.24 low. That level would generate a short-covering and an
oversold rally.
The QQQQ daily is also in the “below the line”
condition with the 20 < 50 < 200 and all declining, but also with that positive
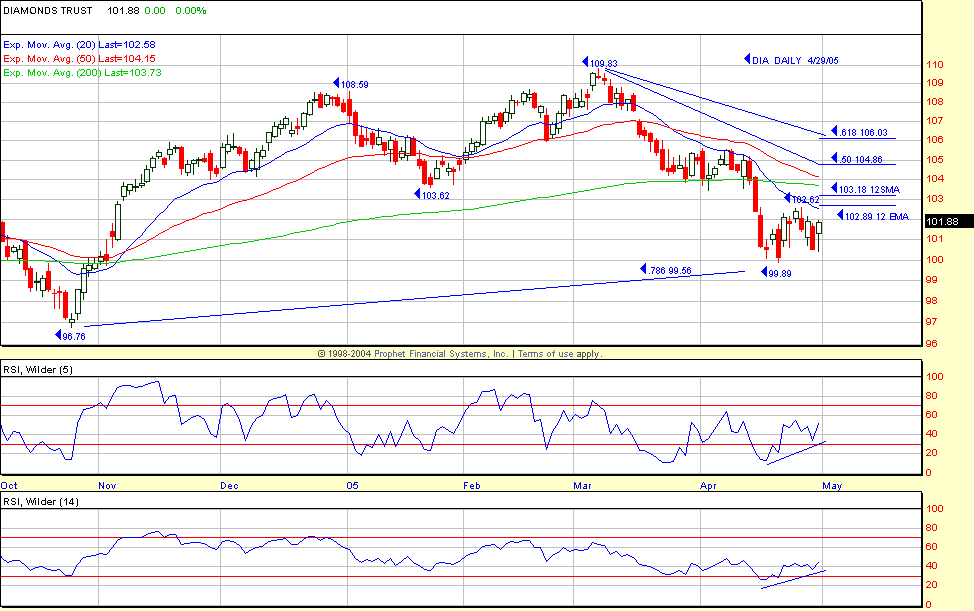
divergence in the 5 and 14 RSI, which is also present in the SPX and Dow. There
is QQQQ major resistance in all three periods from 36 – 37. This oversold
condition with the 34.35 low comes in the 0.786 retracement zone (34.13)
to the August 32.35 low. theÂ
When the SPX rallied toward the 1254.68
retracement zone to the bull market 1553 high, I said in no uncertain terms that
the fifth leg could not get extended much more unless the semis
participated–and they didn’t–and remain in the same negative condition as the
QQQQ and Nasdaq in all of the monthly, weekly, daily time periods. There is a
positive divergence in both the 5 and 15 daily chart RSI, with an RST setup in
the $SOX (not SMH) on Friday if it can trade and close above Friday’s high. In
the primary sectors, the BKX is trading below its 200-day EMA in a BTL (below
the line) condition, same as the QQQQ and Nasdaq. The CYC, XBD and RTH
have daily chart conditions where the 50 is above the 200 and the 20-day EMA is
below the 200-day EMA but all of them have closed and are trading below their
200-day EMAs. I see that the brokers were downgraded today, which is certainly
not a show of confidence for and sustainable rally. The XBD has declined -13% so
far from its 153.37 double top, closing at 137.42 on Friday, with the 200-day
EMA at 140.23 and primary resistance at 142.50 -144. The primary sectors that
remain “above the line” are the XLE {energy) XLU (utilities) and PPH
(drugs) but a strong market would have the semis, brokers, retails and BKX in
that condition. Also, the transportation index closed at 3426, below its
200-day EMA of 3474 so the evidence is clearly business cycle down.
Any rallies above the longer-term EMAs in the SPX
and Dow will set up 1,2,3 lower top short situations but daytraders will be
taking any intraday setups at the 200-day EMAs and primary resistance levels
which can be held if profitable at day’s end.
The immediate SPX downside focus is the 12-mnth
moving average zone of 1151 -1152.
Have a good trading day,
Kevin Haggerty
P.S. I will be
referring to some charts here:
www.thechartstore.com in the future.


