Dave Landry On Laying The Foundation For Successful Swing Trading, Part I
To those new to swing trading, this course contains a
brief introduction to my approach to the markets. It is not intended to be a
complete methodology. Rather, it’s a base upon which on upon which one can
build.
Swing Trading Defined
Swing trading is simply short-term trading. Positions are
held, on average, for 2 to 7 days. Under ideal conditions, positions can be held
much longer, creating the occasional “home runâ€. My style of swing trading is
momentum based. This means that I first seek to identify a trend and then look
for a place to enter. Although I do have some transitional patterns (early
trend), I do not attempt to pick tops or bottoms.
Trading Pullbacks
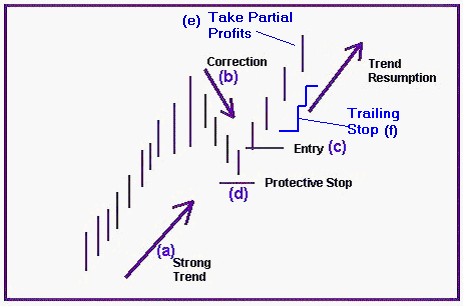
I believe “The Trend Is Your
Friend†is the truest market adage. And, the best way to enter trends is on
pullbacks. Therefore, momentum pullbacks and variations thereof are my favorite
patterns. They consist of a market in a strong trend (a) that has begun to
correct (b). An entry is triggered when the trend begins to resume (c) and a
protective stop is placed below the low of the setup (d). As the trend
continues, partial profits should be taken (e) and the stop on the remaining
shares should be trailed higher (f).
Let’s break it down:
Identifying Trend
The great thing about stocks that are
trending is that they leave clues behind. I have dubbed these clues “Trend
Qualifiersâ€. They include base breakouts, gaps, laps, wide range bars, strong
closes, new highs, and how much a stock moves over a given period of time on a
percentage or point basis. The behavior of moving averages can also be used to
help determine trend.
Let’s look at an example of trend
qualifiers.
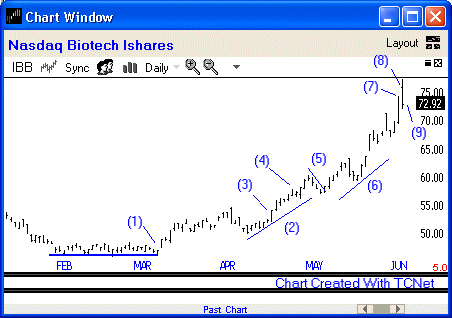
- The Nasdaq Biotech Ishares (IBB)
gaps to new 1-month highs out of a low-level base. Notice the move is on a
wide range bar and the stock closes well (in the top of its range). - The stock gains over 20% in 16-days
as the trend gains strength. - Notice that this strength began
with a wide range bar higher that closed strongly. - Also notice that the stock is
hitting new multi-month highs during this period. - The stock has an orderly pullback.
- The trend resumes.
- The stock has an extreme wide range
bar higher. Although this is a sign of strength, at this point, you have to
begin to question if the move has exhausted itself. This is normally a good
time to take some profits and tighten your stop on your remaining shares. - The stock gaps to 1-year plus
highs. - The stock reverses and closes
poorly. At this point, you have to begin to question if the trend has ended
and a new trend in the opposite direction is emerging.
Now let’s look at the same chart with
the moving averages. My favorite moving averages are a 10-period simple and a 20
and 30-day exponential. These are explained further in my book Dave Landry On Swing Trading in Chapter 7, Bow Ties.
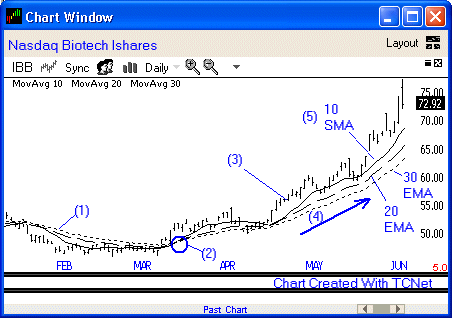
1.
The moving averages are sloping downward.
2.
The moving averages come together and turn up. This
action forms a “Bow Tie†(see Chapter 7).
3.
Notice that there is “daylight†between the stock’s
lows and the moving averages (i.e. the lows are greater than the moving
average). This is a sign of strength as the stock gains momentum.
4.
Notice that the slope of the moving averages is
positive (up).
5.
Also notice that the moving averages are in “proper
orderâ€â€”