Day Trading Advantage with Volatility Bands
From 1990 to 1997, Kevin Haggerty served as Senior Vice President for Equity Trading at Fidelity Capital Markets, Boston, a division of Fidelity Investments. He was responsible for all U.S. institutional Listed, OTC and Option trading in addition to all major Exchange Floor Executions. For a free trial to Kevin’s Daily Trading Report, please click here.
Commentary for 4/30/12
The SPX finished the week +1.8% to 1403.36, and the B/O of the 1392.76-1357.38 12 day range was expected after it closed +1.4% Wed to 1390.69, and above the 20, 50, and 200DEMA`s. The index was up 4 straight days and 5 of the last 6. However, the economic data in the US has been soft since the March jobs report, and the European economies continue to weaken significantly.
A political Bernanke kept the “QE 3 dream alive” in the last FOMC statement. The primary theme in focus is that Bernanke has reaffirmed his put on possible additional QE, and on Wed he pledged to take action should economic trends warrant such a move. The economic data in the US has been soft following the March jobs report, but has been essentially ignored as a potential QE 3 takes precedence. The only economic number anyone really cares about this week is the Fri BLS jobs report.
Click here to order your copy of The VXX Trend Following Strategy today and be one of the very first traders to utilize these unique strategies. This guidebook will make you a better, more powerful trader.
The analysts have made significant downgrades for Q1 estimates, and now the herd is hyping that many companies are beating expectations etc. The managed earnings game by the corporations makes tools of the analysts that beg for the data. The economy, like Obama, is still getting the benefit of the doubt. Europe is what it is, as Spain and Italy share the spotlight for now, but the only thing that matters to the day trading business are the reactions that give us opportunities.
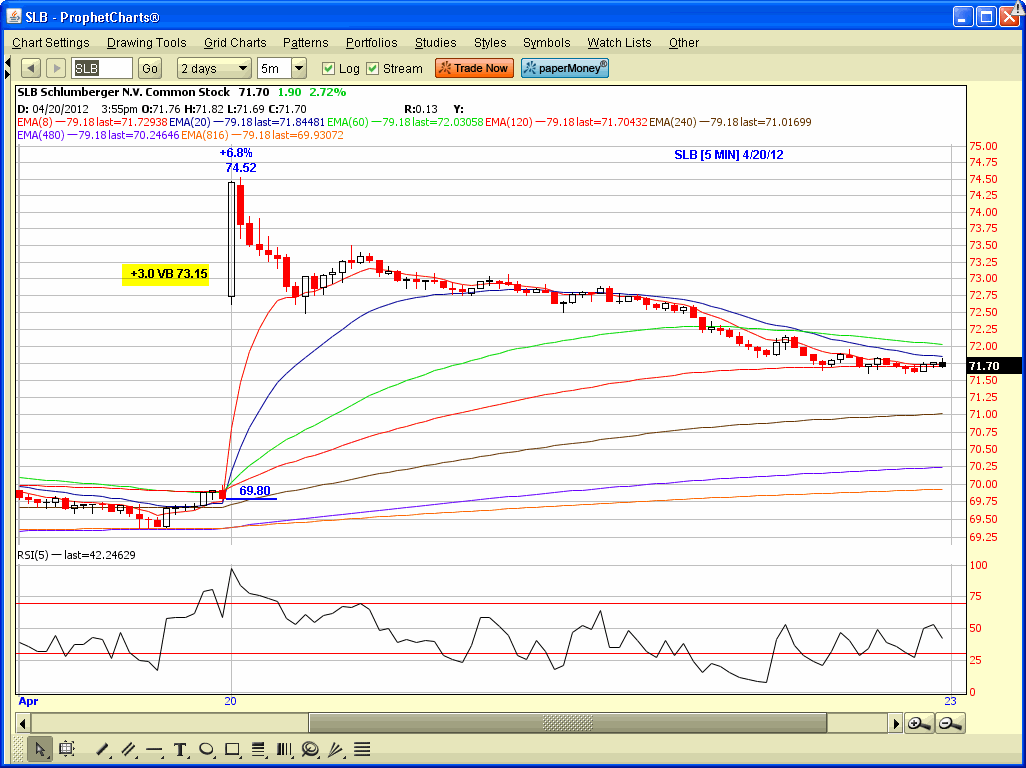
In the previous commentary for 4/23 I mentioned what a joke electronic execution is in the opening period, and showed you the SLB extended +3.0 VB gap on earnings. I thought you would be interested in the follow up trades last week for SLB which provided even more extended Volatilty Band [Standard Deviation] opportunities.
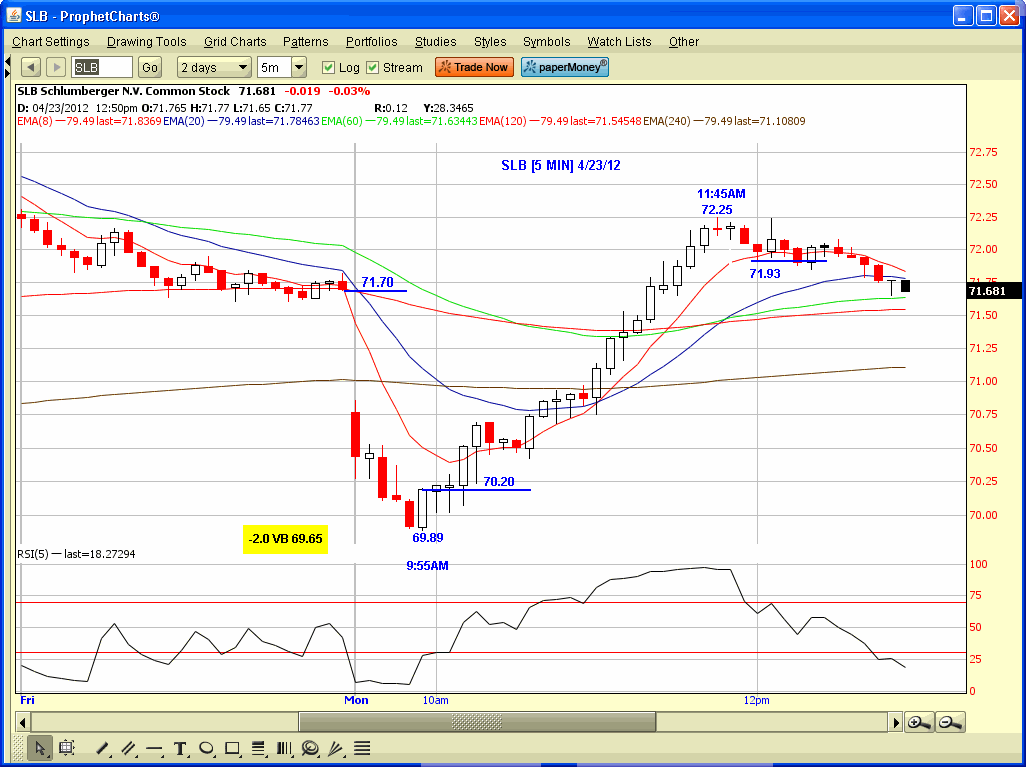
The intial SLB +6.8% earnings gap was on Fri 4/20, and was obviously an excellent day trading extended VB short opportunity. On 4/23 the stock continued the 4/20 pullback to 69.89 where it started from on 4/20. That set up the -2.0 VB long day trade and it ran to 72.25, so you won the game again.
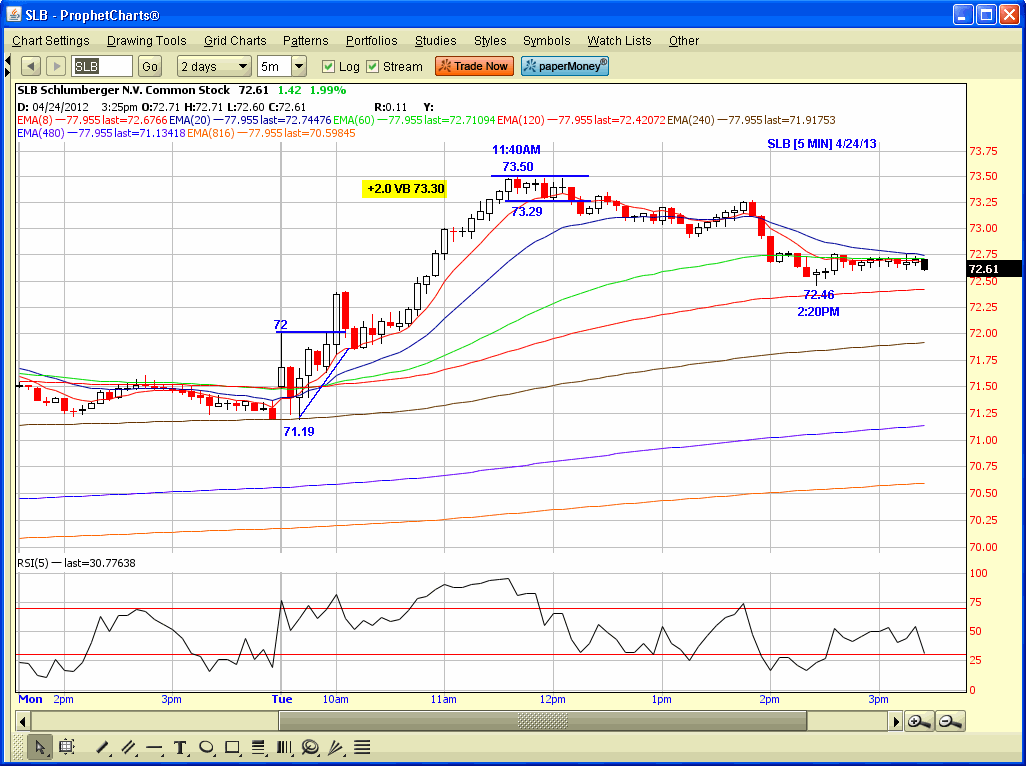
On 4/24 SLB B/O of an opening range Flip Top pattern and ran to the +2.0 VB at 73.30 versus the 73.50 high and 73.29 low It was a narrow range Slim Jim setup at the +2.0 VB so the short was taken, but it only declined to 72.46 before trading sideways. However, you were green on the trade.
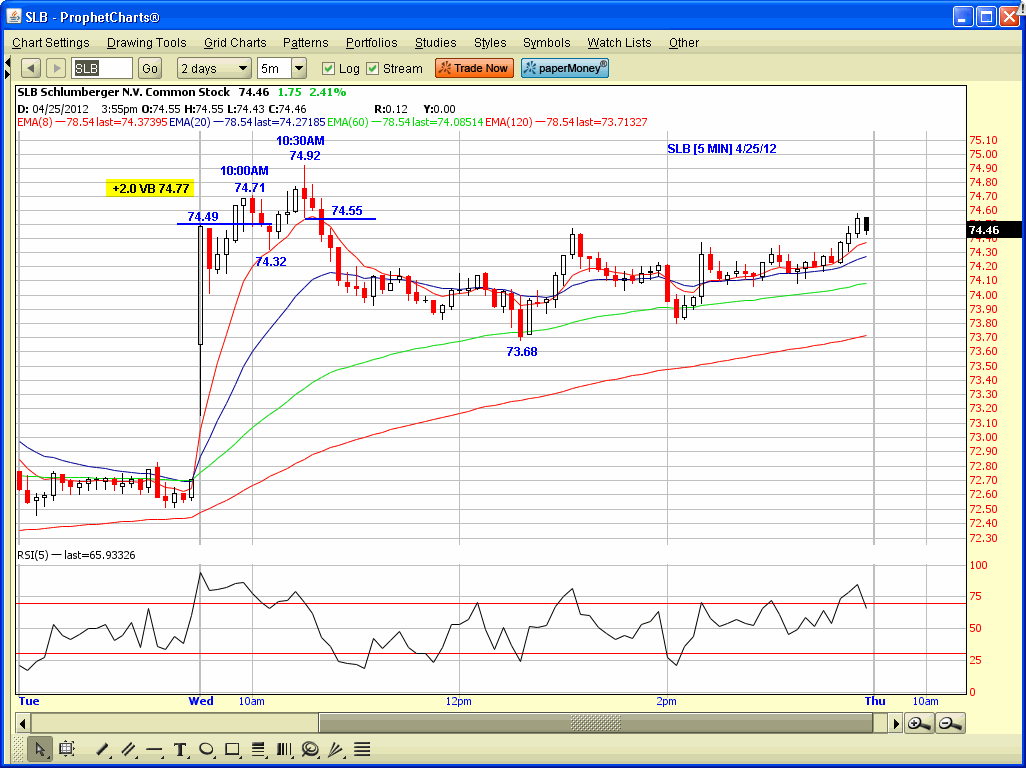
On 4/25 SLB had another gap up opening to the +2.0 VB zone, and in this particular case the initial short entry was taken below 74.49 and covered for a minimal loss, and the second short entry was taken below 74.55 following the 74.92 high versus the +2.0 VB at 74.77.
If you are day trading and not familiar with how to trade these extended VB opportunities you can take a free one week trial to my Trading Service which is published on the trading markets site.
Also, you can learn how to time major and minor market reversals using geometric symmetry if you go to the site www.geometricmarkets.com where you can download for free 6 of my calculators that I use to measure price and time symmetry, and the brand new 200+ page manual “Markets Trade with Geometric Symmetry” is also available for purchase.


Click here to find full details on Kevin’s courses including Trading with the Generals with over 20 hours of professional market strategies. And for a free trial to Kevin’s daily trading service, click here.
