Daytraders In Reaction Mode With First-Hour Strategies
What Thursday’s Action Tells
You
The recent supply/demand equation has been
tilted
by the Generals to the demand side because of the end-of-quarter mark-up and
some money put to work the first day of April. This has made the short-term
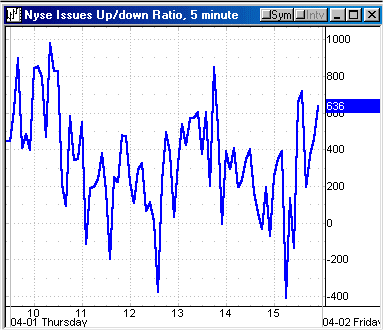
condition overbought. The 4 MA of the volume ratio is now 71 and it’s been
65
and above for the past four days. The 4 MA of the breadth is +1114, and the
five-day RSI has been above 65 for the past five days. Net net, the Generals
are
in motion.
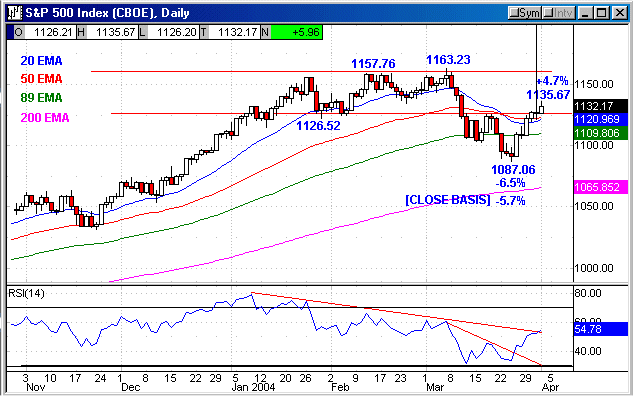
The SPX
(
$SPX.X |
Quote |
Chart |
News |
PowerRating) closed at 1132.17,
+0.5%,
yesterday, with NYSE volume the most since March 15 at 1.52 billion. The
volume
ratio was 69 and breadth +1063. The Dow
(
$INDU |
Quote |
Chart |
News |
PowerRating) with the announced new
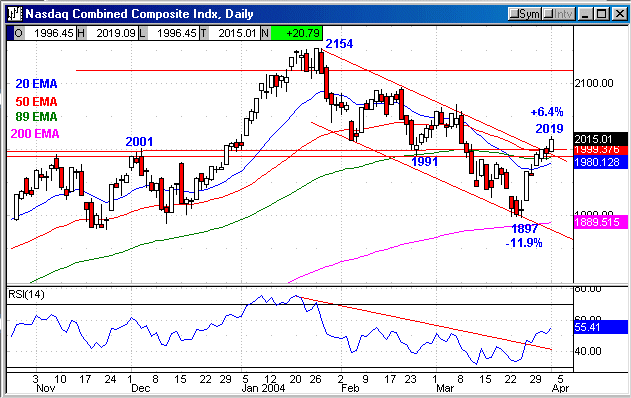
additions/deletions was -0.2%, with the Nasdaq
(
$COMPQ |
Quote |
Chart |
News |
PowerRating) +1.0% and the
(
QQQ |
Quote |
Chart |
News |
PowerRating)s +0.9%.
The semis led in the sectors, with the
(
SMH |
Quote |
Chart |
News |
PowerRating)
+1.6%, with really only
(
MU |
Quote |
Chart |
News |
PowerRating) +1.1% and
(
NSM |
Quote |
Chart |
News |
PowerRating) +2.3% on above-average
volume.
(
QLGC |
Quote |
Chart |
News |
PowerRating) took the big downside hit on the opening and closed at
about
-23% on the reduced earnings and revenue forecast. Going into they day, QLGC
was
trading below all of its 20-, 50- and 200-day EMAs and had already
declined -33%
from 60 on 11/06/03 to 40 on 03/22. Certainly the Generals were not happy
with
QLGC well before yesterday.
The
(
OIH |
Quote |
Chart |
News |
PowerRating) was red at -2.7% on a
wide-range-bar reversal at the 20-day EMA after a five-day reflex up off the
89-day EMA. The OIH has made lower highs and lows since the 03/02 75.28 high
down to the 66.50 low on 03/24 at the 89-day EMA where the five-day rally to
70.70 started. This decline comes in the face of all the headlines about
“no top
in in gas prices,” etc. (And so the beat goes on.) The only two ETFs,
etc., with
above-average volume yesterday were the
(
SWH |
Quote |
Chart |
News |
PowerRating) — software HOLDRs —
+1.8%,
and the XLF +1.2%. In the major indices, it was the
(
IWM |
Quote |
Chart |
News |
PowerRating) — Russell
2000
iShare — at +1.1%.
| Â | Friday 3/26 |
Monday 3/29 |
Tuesday 3/30 |
Wed. 3/31 |
Thurs. 4/1 |
Index |
 |  |  |  |  |
| SPX |
 |  |  |  |  |
High |
1115.27 | 1124.37 | 1127.60 | 1130.83 | 1135.67 |
Low |
1106.13 | 1108.06 | 1119.66 | 1121.46 | 1126.20 |
Close |
1108.20 | 1122.47 | 1127.00 | 1126.21 | 1132.17 |
% |
-0.1 | +1.3 | +0.4 | -.07 | +0.5 |
Range |
9.1 | 16.3 | 7.9 | 9.4 | 9.5 |
% Range |
23 | 88 | 93 | 50 | 63 |
INDU |
10213 | 10330 | 10382 | 10358 | 10373 |
% |
-.06 | +1.1 | +0.5 | -0.2 | +0.2 |
Nasdaq |
1960 | 1993 | 2001 | 1994 | 2015 |
% |
-0.4 | +1.7 | +0.4 | -0.3 | +1.0 |
| QQQ |
35.22 | 35.85 | 35.92 | 35.84 | 36.16 |
% |
-0.3 | +1.8 | +0.4 | -0.2 | +0.9 |
NYSE |
 |  |  |  |  |
T. VOL |
1.32 | 1.35 | 1.30 | 1.47 | 1.52 |
U. VOL |
734 | 1.18 | 925 | 819 | 1.04 |
D. VOL |
571 | 166 | 360 | 614 | 472 |
VR |
56 | 88 | 72 | 57 | 69 |
4 MA |
56 | 65 | 75 | 68 | 71 |
5 RSI |
66 | 65 | 70 | 67 | 74 |
ADV |
1789 | 2428 | 2186 | 2029 | 2174 |
DEC |
1499 | 890 | 1089 | 1263 | 1121 |
A-D |
+290 | +1538 | +1097 | +766 | +1053 |
4 MA |
+313 | +581 | +1093 | +923 | +1114 |
SECTORS |
 |  |  |  |  |
SMH |
-0.9 | +1.1 | +0.1 | -0.1 | +1.6 |
| BKX |
-0.2 | +1.5 | +0.4 | -0.3 | +0.7 |
XBD |
+1.4 | +1.6 | +0.2 | +.05 | +1.2 |
RTH |
-0.3 | +1.2 | +0.2 | +0.1 | -0.9 |
CYC |
+0.3 | +1.8 | +1.0 | -0.1 | +0.8 |
PPH |
+0.1 | +1.4 | -0.2 | +0.4 | +0.9 |
OIH |
+1.2 | -0.3 | +2.6 | +0.5 | -2.7 |
| BBH |
-1.5 | +2.1 | -0.3 | -0.6 | +1.9 |
TLT |
-1.1 | -0.7 | -0.7 | +0.5 | -0.3 |
| XAU |
+1.0 | +0.9 | +1.1 | +0.4 | +0.4 |
 ^next^
For Active
Traders
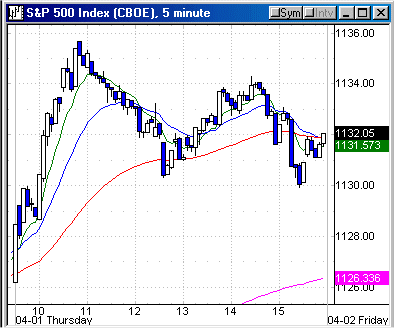
The initial trade opportunities came at the
familiar 10:00 a.m. ET time period where “things just seem to
happen.” It was a
45-minute rally, which took the major indices to their intraday highs where
the
best opportunities awaited the prepared trader. The SMHs traded to 40.49,
the
high end of the 40 – 40.50 zone (see March 31 commentary for all of these
levels
you were prepared for) and reacted down to 39.90, closing at 40.13. This
corner
is flat now into the resistance zone.
The QQQs traded to 36.25 in the middle of the
36
– 36.50 zone, then traded down to 35.92, but closed at 36.16. The
(
DIA |
Quote |
Chart |
News |
PowerRating)s
traded to 104.38, which is the .618 retracement zone, making a 104.36 high
on
the 10:45 a.m. bar before going trend down to 103.62 around 3:30 p.m. This
was
right at the 240 EMA and price then rallied up to a 104.08 close in the last
half-hour. You should have played, at a minimum, one of those three moves,
and
hopefully it was the sell entry, which had the most definition, and from
zones
you were ready for. I trust all of you new sequence traders saw the
additional
confluence at yesterday’s intraday highs, which was almost to the penny in
price
and at your anticipated zones/levels. (Check DIA first.)
Today’s
Action
With the jobs circus this morning, daytraders
are
in reaction mode with the First-Hour strategies. Other than that, take the
day
off.
Have a good trading day,
Kevin Haggerty


