December Could Be a Very Interesting Month
For the first time in ages, we’ve seen two
directional sessions inside one week. Both of them were down, down sharply and
on high volume. With triple-witch expiry and emini futures rollover ahead, next
week could be even more active than that.
Chart 1: ES (+$50 per index point)
S&P 500 made a feeble attempt to lift off the
open, then sold in repeated waves down the chart. A midday squeeze failed below
the pivot, and promptly cratered to new session lows. Short signals worked more
than not, all day long.
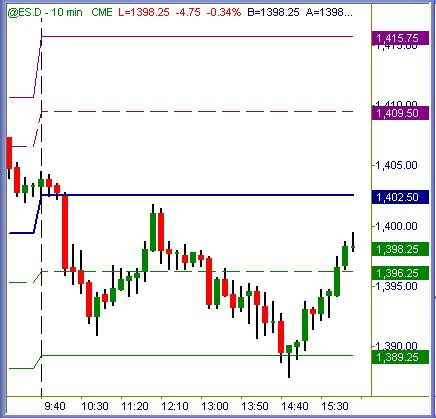
Chart 2: ER
(+$100 per index point)
Russell 2000 futures were smoother to trade, and
more profitable per contract as usual. They offered numerous short trade signals
from near opening bell all the way lower. Not a huge range day, but the typical
selloff that paints a much more orderly tape than buy program-slam rubbish
action we’ve worked thru as of late.
Monday and Friday each offered a ton of potential
points’ profit… enough to make a decent week inside either 6.5 hour session.
I’d expect more of this to come, unless markets halt the recent slide right now.
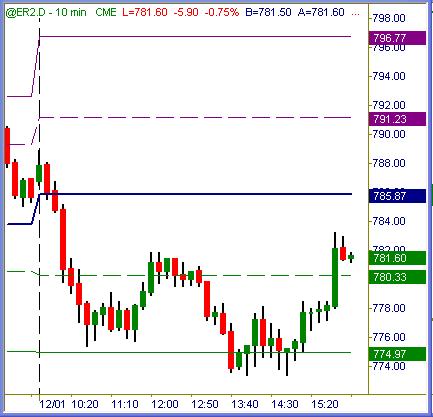
Chart 3: ES (+$50 per index point)
S&P 500 futures found support at 50% of the most
recent swing low to high. In order to keep the bulls content in their green
pastures, 1382 and especially 1375 need to hold any tests. For sure there are
clusters of buy stops just above = sell stops just below each mark.
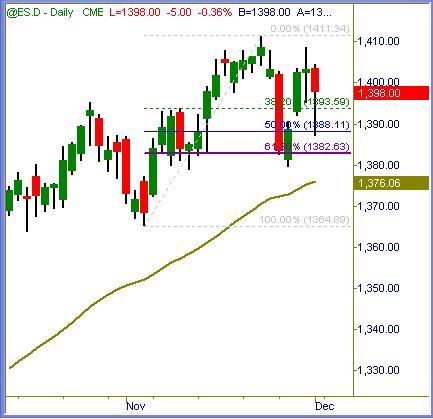
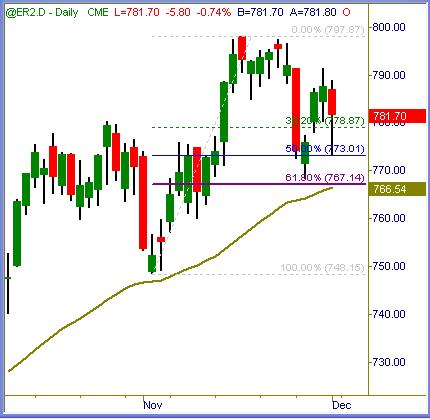
Chart 4: ER
(+$100 per index point)
Russell 2000 futures have the 766+ level as dual
support drawn on literally 1,000s of small-cap traders’ charts. Wouldn’t be
surprised to see those levels trade early next week… quite possibly Monday. It
will be decision time for the markets if/when that happens.
Summation
We’ve repeatedly talked about unknown catalysts shaking up market action. It
appears that the USD plunge may be that unforeseen event to rock the xmas rally.
Charts have not broken any levels of key support as of yet, first & foremost.
But they do show more weakness than strength. Rising in agony on light volume
program pushes, falling under their own weight on heavy volume twice this week.
Expect the dipsters to view this as another great
buying opportunity. Maybe it is… most similar events have rebounded sharply
upward to reward hitting the dips. Eventually there won’t be a bottom below
those buyers, which will begin the next extended correction. Until the daily
charts (at least) break down to confirm weakness, sideways chop to upward
continuation is probable. If the daily charts lose 50dma support, watch for
accelerated selling in red charts to line our pockets with green.
As noted earlier, Thursday morning 12/07 marks
the March 2007 (M07) emini contract as front-month in the pits. More often than
not, there is at least one large-range directional session inside the rollover
week. Could be any of the first four, with Tuesday or Wednesday most likely
candidates.
In any event, intraday traders needn’t worry so
much about what’s to come or why. Matter of fact, that type of market guesswork
often clouds intraday trade performance. Having a solid method and taking the
clear signals accordingly without bias usually leads to some profitable
surprises. Only when intraday traders try to form a bias or opinion do they pass
on otherwise profitable trades heading the opposite way.
November’s 13-year lows in volatility may have
spawned an active to wild December ahead. We can only hope for the best: viva la
volatility!
Trade To Win
Austin P
(Online
video clip tutorials…
open access)
Austin Passamonte is a full-time professional trader who specializes in E-mini stock index futures, equity
options and commodity markets. Mr. Passamonte’s trading approach uses proprietary chart patterns found on an
intraday basis. Austin trades privately in the Finger Lakes region of New York.