Dissecting the Dow for E-Mini Traders
My experience has been that most index E-mini traders conduct trades strictly via technical analysis, on the price of the futures contract itself. Technical Analysis, in and of itself, is a superb tool to illustrate past market action and subjectively project potential price targets into the future. It is not an objective science and often fails to deliver what the trader expects due to unrealistic demands on the discipline.
The name itself “analysis†makes it clear that it is best suited for analyzing what has occurred rather than what will happen on the hard right edge of the chart. While a proper understanding of TA is a must for every trader, it’s critical that it is understood that TA is simply a tool to illustrate past price movement, in order to gain a deeper understanding of what occurred. TA is not a crystal ball to look into the future.
Not only should the future contract itself be “technically analyzed†but the major components of the index must be “technically analyzed†individually to gain a more complete understanding of the instrument. Many traders fall short on the complete analysis while trading the index futures. This article will drill down into the top 5 weighted components of the DJIA, as they are right now, so you can better understand how and why the Dow E-mini moves.
Its purpose is to show that there are many deeper ways to analyze an index other than simply looking at the price itself of the index. The DJIA is a weighted index, meaning that more significance is placed on certain stocks than others. The heaviest weighted ones obviously possess more influence over the directional movement of the index than the lighter ones.
The top 5 DJIA components and their total weightings are:
IBM – 8.88%, Chevron – 6.09%, Exxon – 5.52%, 3M – 5.15%, and Johnson & Johnson – 5.03%
Here are Daily technical charts of each of the 5 major components of the DJIA. I find it interesting to note that 2 of the 5 DJIA heavy weights are oil based companies.
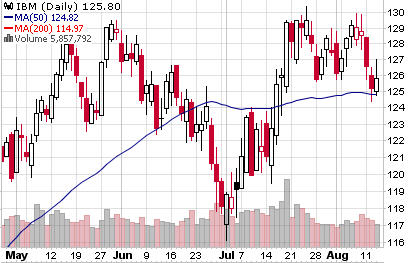
International Business Machines
(
IBM |
Quote |
Chart |
News |
PowerRating): As you can see, price is sitting right on the 50-day SMA of 124.82, but a double top formation is clearly evident:
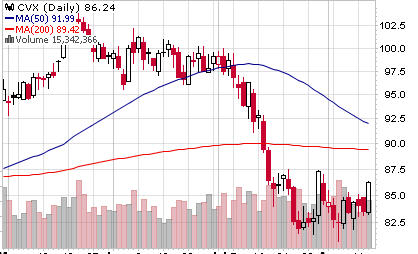
Chevron
(
CVX |
Quote |
Chart |
News |
PowerRating): Price is below both the 50 and 200-day SMA’s and a base appear to be potentially forming in the low to mid 80’s.
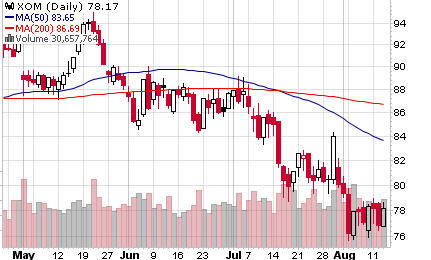
Exxon
(
XOM |
Quote |
Chart |
News |
PowerRating): This chart is very similar to the Chevron chart above, which isn’t surprising given they are both in the oil business.
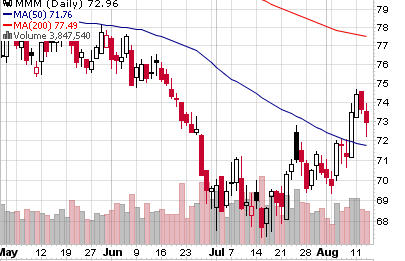
3M
(
MMM |
Quote |
Chart |
News |
PowerRating): Price broke above the 50-day SMA earlier in the week and now seems to be dropping back down
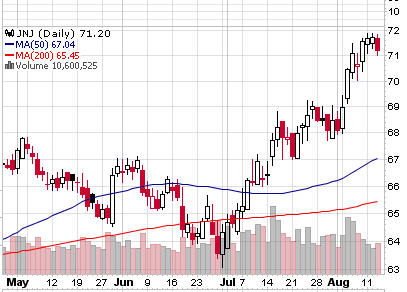
Johnson & Johnson
(
JNJ |
Quote |
Chart |
News |
PowerRating): This stock has been in a strong uptrend since the beginning of July. It’s above both the 50 and 200-day SMA’s
Digging deeper into each of these DJIA leaders, the following is their relative performance.
IBM is down .062% over the last 3 months, it’s up 3.01% over the last month and is up .46% over the last day of 8.12.2008. The % difference , stock minus the DJIA for one day is 1.40.
Chevron is down 11.76% over the last 3 months, it’s down 6.51% over the last one month and it’s up 3.21% over the last day of 8.12.2008. The percent difference, stock minus the DJIA for one day is 4.15.
Exxon Mobile is down 12.83% over the last 3 months, it’s down 8.55% over the last one month and it’s up 1.68% over the last day of 8.12.2008. The percent difference, stock minus the DJIA for one day is 2.62
3M is down 5.47% over the last 3 months, it’s up 6.17% over the last month and it’s up 1.68% over the last day of 8.12.08. the percent difference, stock minus the DJIA for one day is .07.
Johnson & Johnson is up 7.21% over the last 3 months, it’s up 7.46% over the last one month and it’s down .70% over the last day of 8.12.2008. The percent difference, stock minus the DJIA for one day is .24
The dividend yield of each of the components is another factor that many traders do not consider when analyzing an index. Here are examples of the projected dividend and dividend yield of the 5 DJIA heavyweights:
IBM: dividend = 2.20, yield = 1.75
Chevron: dividend = 2.67, yield = 3.10
Exxon: dividend = 1.70, yield = 2.17
3m: dividend = 2.06, yield = 2.82
Johnson & Johnson: dividend = 1.88, yield = 2.64
There is only one stock in the DJIA that doesn’t pay dividends.
These are just a few examples of how an index can be analyzed other than by the price itself of the index. Serious E-Mini traders will have a deep understanding of every stock in the index to make better trading decisions.
Best Wishes!
David Goodboy is Vice President of Marketing for a New York City based multi-strategy fund.