Do The Work
Tuesday’s
action with negative breadth and
a 58 volume ratio in spite of the indices advancing and 1.9 billion shares was
certainly exposed yesterday as the major indices and all major sectors took a
dive. NYSE volume was 1.8 billion, a volume ratio of just 14, and breadth
extreme negative at -2322, with the four-day moving average now at -1456.
Certainly most all
sentiment and momentum indicators are at very oversold levels and price is
almost at the 3.0 standard deviation band on all the major indices. This Friday
is a minor cycle day. The July
rally from 776 – 965 was +24% and +189 points in 21 days. The current decline is
34 days old and -20% and -189 points. The 1.618 extension in time for 21 days is
34, both Fib numbers.
The semis had some buying
as the
(
SMH |
Quote |
Chart |
News |
PowerRating)s were green for the better part of the day until they sank in
the last hour to finish -0.9% on the day. Banks and brokers reversed, losing
-4.6% and -4.4%. The cyclicals also got whacked, with the CYC index -4.7%.
As a trading day, it was
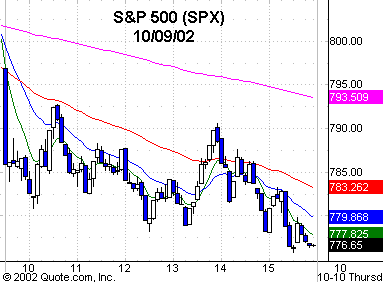
choppy at best. The SPX
(
$SPX.X |
Quote |
Chart |
News |
PowerRating) gapped down and hit a 780.83 low by the
10:05 a.m. ET bar, down from the previous day’s 798.26 close. There was a quick
Trap Door rally to 792.77 and then back down to 778.17. After another rally to
791, the index traded down to an intraday low of 775.80 vs. the July low of
775.68, and closing at 776.23.Â
The major sectors to
watch for Change in Direction bars on the daily chart, which are needed before
any early reversal in the major indices takes place, are the SOX/SMH, CYC/XLB,
BKX, XBD, and also the RLX/RTH. For more confirmation, you move to the weekly
and monthly charts. For example, put a one-year monthly chart of the SOX up, and
you can easily see that something has to happen to reverse the seven straight
months down with lower highs and lower lows with closes in the bottom of the
range. Do the same with the other sectors and major indices. Pull up the
longer-term weekly and monthly charts to see previous bottoms and what they look
like. You will see many similar examples of what happens as markets turn up.
The trading entry is off
the daily charts, but any decision on higher equity allocation for longer-term
money should be made from the weekly and monthly charts. When I look at the XBD,
BKX, RLX, CYC and SOX monthly charts, it tells me the decision is obvious. No
indication of a reversal yet. From a trading standpoint it’s a different game,
as you always look for more aggressive entries and as bottoms develop, that
means a series of probes to catch the move. You have to determine where you fit
in. What I get from the e-mails is that it is daytrading and then waiting to put
longer-term money to work in your IRAs, etc. I happen to think that’s the best
of both worlds and affords you the luxury of waiting for confirmation from the
weekly and monthly charts before you commit to longer-term positions.
My opinion of a bottom
period hasn’t changed, as it remains this fourth quarter into the 20-year
four-year cycle period, as this bear market enters its thirty-first month. From
a numerical standpoint, I think the 670 – 650 level will be the worst case
before a substantial rally of 40% – 50% and that doesn’t mean it has to get
there before the market turns. The daily chart price and volume data will give
us a loud alert when something’s going on.
Also, there doesn’t have
to be capitulation for a bottom. That usually happens when it is an event-forced
selloff, but in a recession and long bear market like we are in now, it can also
be a natural bottom, ending quietly as it starts to roll under. I have seen both
kinds since 1969. The unknown factor, of course, is Iraq, and we can’t control
that. This is my personal opinion,
which is subjective and can’t be quantified, so it’s not worth bupkis, but I can
highlight what to look for, so you can be alert for where and how to identify
when a market is reversing.Â
There is a confluence of
about five things in the 670 – 650 zone, with 658 being the .618 retracement to
the 1982 low the most obvious. Markets don’t like to fulfill the perfect
scenario very often, so that’s why we must let price and volume tell us because
the current zone on the SPX also has such strong confluence.
At this level on the
indices, there will be excellent two-way opportunity over the next few days, so
take the trades and manage your risk and don’t freeze in the headlights.
Have a good trading day.

Five-minute chart of
Wednesday’s SPX with 8-, 20-,
60- and 260-period
EMAs

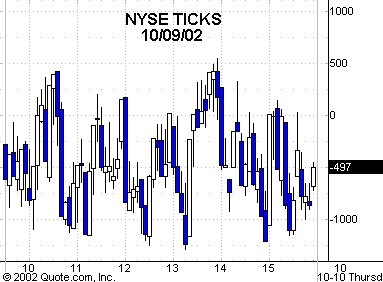
Five-minute chart of
Wednesday’s NYSE TICKS
