Do you trade triangles? Try this…
One of the great things about
PowerRatings
is that they can be used in so many different ways. Once you
understand the basics, you can combine them with a myriad of trading styles.
Each day I’m going to highlight some of the different ways you can incorporate
PowerRatings
into your existing trading strategies and hopefully teach you a few new ones
along the way. I’ll also show you some of the ways our members are using
PowerRatings
to improve their trading.
In today’s example, let’s take a look at Kendle
International
(
KNDL |
Quote |
Chart |
News |
PowerRating).
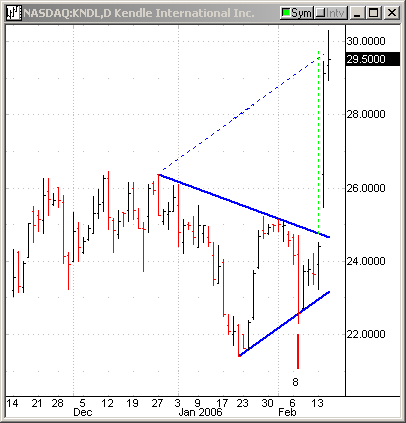
KNDL recently formed a symmetrical triangle. This
pattern requires at least two lower highs and two higher lows. These points are
then connected to form a triangle (solid blue lines).
Symmetrical triangles are usually continuation
patterns, meaning they tend to be resolved by a breakout in the direction of the
previous trend. In this example, the previous trend wasn’t clear. KNDL had been
moving sideways for more than two months before forming a triangle.
However, KNDL did establish a strong uptrend in
the six months before its’ sideways pattern suggesting an upside resolution was
possible. When a breakout occurs there are two common techniques to determine a
price target. You can extend a trend line parallel to the pattern’s line that
points in the direction of the breakout (dotted blue line), or the more popular
technique is to measure the widest part of the triangle and project that
distance from the breakout (dotted green line).
In this case, both points line up identically
(the green line should be moved one bar to the right). Normally, you can’t make
these projections until after the breakout, which means in this case you would
have missed the move as it occurred in just one day. However, if you were using
PowerRatings
you would have been able to catch this big breakout — here’s why.
On 2/07 KNDL recorded a
PowerRating
of 8. This indicates that a strong move higher is expected over the next 5-days.
If you then made the projections listed above you would have seen the potential
profits offered by going long.
Also, your risk is low because your stop loss
could be either a break below the triangle, or simply to wait until the
PowerRating
was no longer indicating a strong move higher and that the 5-day period since
the initial
PowerRating
of 8 had elapsed.
In this case the 5-day gain was over 29%.

Click here
to take a free trial to
PowerRatings.
You can also
attend a free
class on how to use
PowerRatings
presented by Steve Primo, our Director of Education.
Ashton Dorkins
Editor-in-Chief
