Dollar bulls look to Bernanke
The dollar remains well bid this
morning ahead of expectations that Fed Chief Bernanke could hint at yet another
rate hike to 5.5% next month, should inflation expectations still haunt the
board. CPI this morning came higher than exepcted, rising at an
annual rate of 4.3% while core rose at 2.6% y/y, so that is a possibility.
We took profits in 1/2 our USDMEX short position today,
expecting to see a rebound back to 11.05 where we have more orders to sell.
We’ve played this post election rally extremely well (and prepared you for it
months in advance). We pared back our USDMEX position because other commodity
positions like AUDUSD fell over 100 pips in the last two days, suggesting a
potential pullback after two weeks of strong gains.
Nevertheless, we maintain a bullish view on the peso and
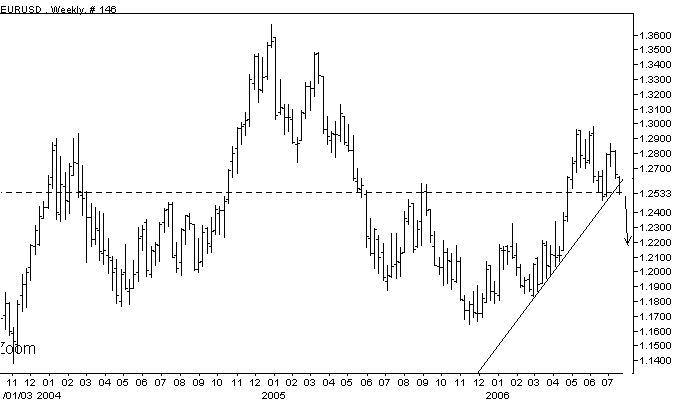
Aussie while the crack below weekly trendline support at 1.2650 in EURUSD we
said last week would open up the strong potential for a swarm of dollar short
covering this week. Recall in our weekly report on Sunday we said the massive
net long position by traders and inability to push EURUSD above key resistance
at 1.30 meant the “ammo was spent.”
We have so far fallen back to 1.2470 today which is testing
the June 18 weekly lows seen in the chart below. This low marks the 38.2% Fib
retracement of the November lows to June highs and a sustained move below here
opens the way for a test of the 50% retracement and former highs at 1.2310.
An interesting side note is whether this is a massive H&S
pattern in the making with the 1.30 highs being the right shoulder? Or could
this be a long ABCDE triangle patterns with wave C down now underway targeting
1.20 before we reverse higher? We will let you know in the coming weeks as the
pattern emerges.
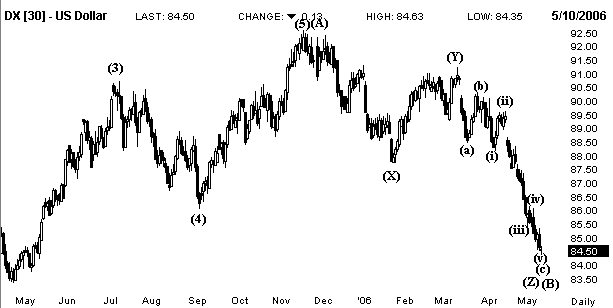
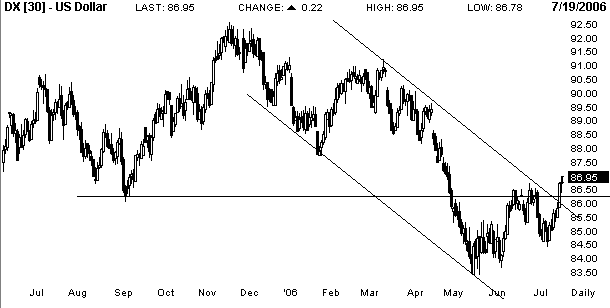
No change: Since we called a bottom at the May lows the dollar
has edged higher and has now cleared channel resistance at 86.00 and is now
sitting above former resistance turned support at 86.50. Next key resistance is
at 87 which will need to be cleared to see sustained gains.
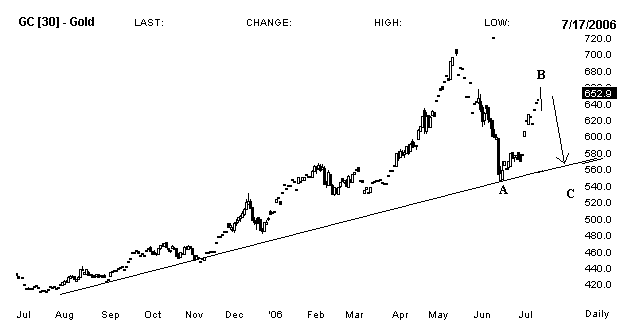
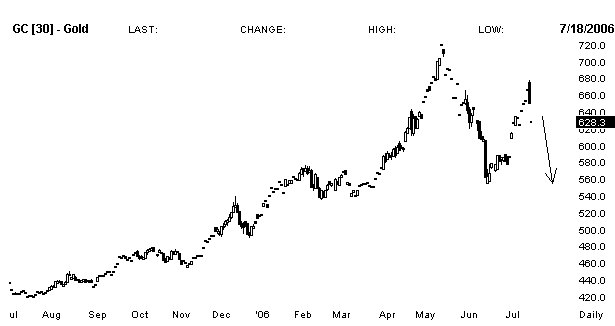
Gold: Gold has sold off considerably, putting our ABC type
decline in better standing. Recall that gold rallied off of our support zone at
$540/$580 and following a five wave rally has now reversed despite mounting
tensions in the middle east. This may be the start of wave C down which we
expect to end the larger “wave II” pullback followed by a soaring “wave III”
rally.
As we have said for months now, “In the broader picture, this
long awaited correction is underway and recall that a top here at $720 will mark
the end of “wave 1 of V” meaning a pullback to $580/540 would be “wave 2 of V”
followed by an explosive rally in “wave 3 of V” to new all time highs.”
Stocks: No change: Stocks slipped below key support at 1245
last week and a sustained move below woluld be quite bearish and would likely
coincide with a strong rally in bonds (decline in rates).
Recall that last week we said, “Key resistance is at 1290 and
we would look to go short at this resistance with risk limited to above 1330 or
more cautiously on a sustained move below 1,250.” Traders that followed that
move shold look to tighten up stops to cost and add to this position upon a
possible slide below 1,250 and then 1,220.
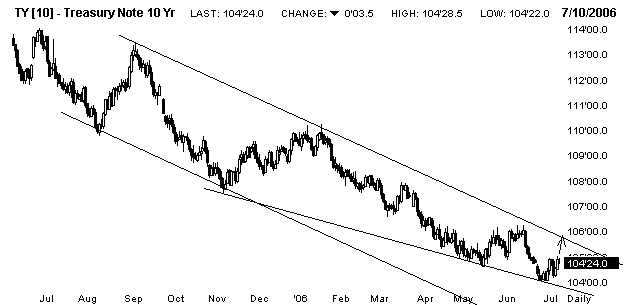
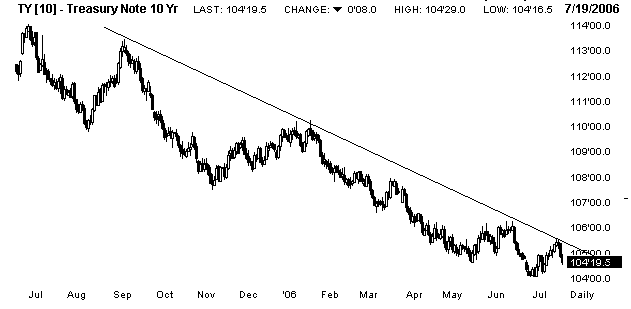
Bonds: Bonds rallied to trendline resistance as we expected
many weeks ago and showed you in the 7/10 update (top chart below). We bounced
off of strong trendline support at 104 and only a move through channel
resistance crossing at 105.50 would suggest that a larger rebound is underway.
We continue to see a rally to 107/109 followed by a renewed delcine below 104.
The reason is that 104 will be a tough nut to crack the first time around and
the majority of players are already extremely bearish on bonds.
Crude Oil: Crude oil reached our minimum upside target at
$78/$80 last week thereby fulfilling the “wave V” rally we said to expect back
in February. The 23% advance has made some subscribers very happy and we commend
you for jumping into this market as you well knew that hedge funds were short
back at $60.
The pullback from our technical target at $78/$80 is now
testing trendline resistance. But with tensions in the Mid-east our target may
not mark the top. The reason we say this is that Crude on a weekly chart looks
like it may go “parabolic.” While impossible to pick when a commodity will
extend like this spec positioning allows for hedge funds and hedgers alike to
buy buy buy.
As we said three months ago, “While not expected, an “extended
fifth” wave would mean that this is just the first leg up within a larger move.
That seems unlikely, but the implications are that either we could top out at
$78 or possibly at $82. A prudent move would be to take some profits there and
wait for a pullback to add back to longs in the hopes of higher highs in the
$82-$92 range.”
Therefore, traders were encouraged to take initial profits at
the $78/$82 range last week and to now either tighten up remaining stops or buy
back in here at trendline support. If we do get a spike, a move to $90/$100
would be were we look to cover and possibly reverse.
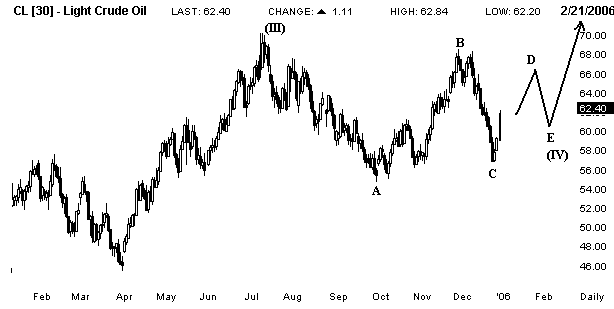
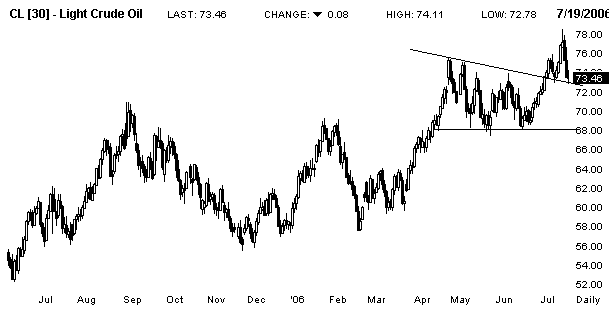
Recommended long at $55 last November. Still looking for a
move to $80-$100 over the coming months.
Jes
Black is the fund manager at Black Flag Capital Partners and Chairman of
the firm’s Investment Committee, which oversees research, investment and
trading strategies. You can find out more about Jes at
BlackFlagForex.com.
Prior
to organizing the hedge fund he was hired by MG Financial Group to help
run their flagship news and analysis department,
Forexnews.com. After four
years as a senior currency strategist he went on to found
FxMoneyTrends.com – a research firm catering to professional traders.
