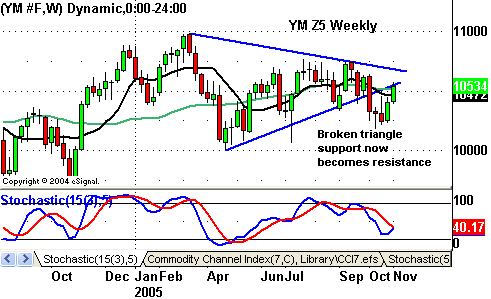
Don’t sell rallies, buy weakness ’til year end
The major
indexes were able to put together another impressive week of gains, and pretty
much traded with an upward bias every day of the week. It was also nice to see
the rally led by Chip, biotech, Internet, and other small-cap shares, which
allowed the NASDAQ Composite and Russell 2000 to display relative strength for a
change. Any time these groups lead, it’s often indicative of a move that has
some potential legs. Economic data was fairly decent overall, which
reinforced
the idea that the economy remains in good enough shape. The same was true with
the earnings data as a whole.
Â

Â
With the
equities markets avoiding a much touted October meltdown, equities now appear to
be seeing some daylight. I have little doubt that all of the wanna-be
Nostradamus’ have scrambled to unwind their bearish bets, while many long-only
fund managers likely started to chase beta. It also appears that sentiment has
shifted from somewhat bearish just 3 weeks ago to a more widespread belief now
that a year-end rally may in fact take place. While little fundamentally has
changed, history has also taught me that it’s generally not worth fighting
year-end rallies.
While a
year-end rally may be a foregone conclusion, the longer-term problems still loom
for the markets. Also, we came a long way in just a few days, which has put a
lot of the key oscillators into the short-term overbought category. So, I
wouldn’t be surprised to see a modest pullback in the days ahead. However,
instead of loading up on shorts, I still feel the better move may be to buy
weakness.
Daily Pivot Points for 11-7-05
| Symbol | Pivot | R1 | R2 | R3 | S1 | S2 | S3 |
| INDU | 10520.84 | 10562.30 | 10593.83 | 10635.29 | 10489.31 | 10447.85 | 10416.32 |
| SPX | 1219.04 | 1223.62 | 1227.11 | 1231.69 | 1215.55 | 1210.97 | 1207.48 |
| ES Z5 | 1221.42 | 1226.33 | 1230.67 | 1235.58 | 1217.08 | 1212.17 | 1207.83 |
| SP Z5 | 1221.33 | 1225.97 | 1229.93 | 1234.57 | 1217.37 | 1212.73 | 1208.77 |
| YM Z5 | 10527.67 | 10569.33 | 10604.67 | 10646.33 | 10492.33 | 10450.67 | 10415.33 |
| BKX | 99.63 | 100.00 | 100.19 | 100.56 | 99.44 | 99.07 | 98.88 |
| SOX | 450.85 | 454.65 | 457.47 | 461.27 | 448.03 | 444.23 | 441.41 |
Weekly Pivots for the Week of 11-7-05
| Symbol | Pivot | R1 | R2 | R3 | S1 | S2 | S3 |
| INDU | 10493.56 | 10598.36 | 10665.96 | 10770.76 | 10425.96 | 10321.16 | 10253.56 |
| SPX | 1214.58 | 1230.26 | 1240.37 | 1256.05 | 1204.47 | 1188.79 | 1178.68 |
| ES Z5 | 1216.42 | 1233.33 | 1244.67 | 1261.58 | 1205.08 | 1188.17 | 1176.83 |
| SP Z5 | 1217.40 | 1232.30 | 1242.60 | 1257.50 | 1207.10 | 1192.20 | 1181.90 |
| YM Z5 | 10498.67 | 10609.33 | 10684.67 | 10795.33 | 10423.33 | 10312.67 | 10237.33 |
| BKX | 99.50 | 100.24 | 100.69 | 101.43 | 99.05 | 98.31 | 97.86 |
| SOX | 443.85 | 461.94 | 472.06 | 490.15 | 433.73 | 415.64 | 405.52 |
Please feel free to email me with any questions
you might have, and have a great trading week!
Chris Curran
Chris Curran started his trading career at the
age of 22 with a national brokerage firm. He combines fundamentals and
technicals to get the big picture on the market. Chris has been trading for 15
years, starting full time in 1997, and has never had a losing year as a
full-time trader.
