Doth the Bear Slumber? PowerRatings Bear Case and 3 Stocks
The stock market has been in a roaring bull market since the start of July. Every pullback has been met with aggressive buying, pushing the Dow Jones Industrial Average above 10400. The 50-day Simple Moving Average has acted as significant support for every pullback with the last test 12 trading days ago.
Has the bear been put into a permanent slumber? Will the roaring bull continue indefinitely into the future? No way, markets simply do not move higher without pullbacks and sometimes substantial ones. The question is simply: when will the pullback occur?
There is a strong case to be made right now that a pullback is imminent. The DJIA is nearly 600 points above its 50-day SMA support level. While not quite a saber rattling fall, depending on the time frame, just another test of the SMA will stir things up in the bear camp. This is not to mention should the 50-day SMA be violated, which is possible. Let’s take a look at some of the market internals to make a case for the bears.
The S&P 500 and Nasdaq have both just made 10-day highs intraday. This fact indicates the market is likely very overbought. Advancing issues are 2 to 1 > then declining issues. Historically, too many stocks rising in one day usually indicates a market that will be quiet or drop. The VIX alert has fired, indicating the VIX is trading 5% below its 10-day SMA. This usually points toward a coming down or at the least quiet market. Finally, our CVR signal is bearish for the S&P 500. CVR is comprised of 14 different studies on the VIX.
As you can see, a strong internal case can be made for the bear to awaken soon. How can the stock trader use this information to find names ready to drop despite the roaring bull market currently? We have developed a simple 3 step plan to locate companies most likely to drop over the next 5 trading days. Remember, these same principles work whether or not an overall market drop occurs or not. In other words, they are stock, not market specific.
The first and most critical step is to only look at stocks trading below their 200-day Simple Moving Average. This assures that the stock isn’t in a long term uptrend that may likely continue.
The second step is to drill deeper into the list locating stocks that have climbed 5 or more days in a row, experienced 5 plus consecutive higher highs, or are up 10% or more. Yes, you heard me right, stocks that are climbing. I know this fly in the face of conventional wisdom of selling stocks as they fall further. However, our studies have clearly proven that stocks are more likely to fall in value after a period of up days than after a period of down days.
The third and final step is a combination of whittling the list down even further by looking for names whose 2-period RSI (RSI(2)) is greater than 97 (for additional information on this proven indicator click here) and the Stock PowerRating is 3 or lower.
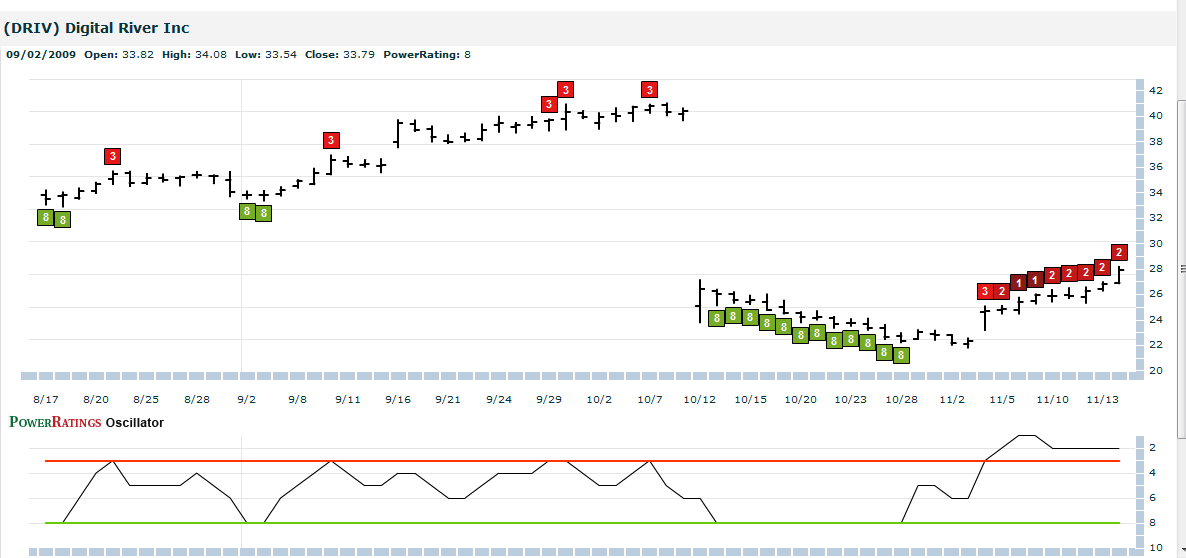
The Stock PowerRatings are a statistically based tool that is built upon 14 years of studies into the inner nature of stock prices. It ranks stocks on a scale of 1 to 10 with one being the most volatile and most likely for short term drops and 10 proven to be the most probable for gains over the next 5 days.Â
The stocks that fulfill each of the above steps have proven in extensive, statistically valid studies to possess solid odds of dropping in value over the 1 day, 2 day and 1 week time frame.
Here are 3 names making the bear case for the short term:
LDK Solar
(
LDK |
Quote |
Chart |
News |
PowerRating)
Digital River
(
DRIV |
Quote |
Chart |
News |
PowerRating)

Omnicare
(
OCR |
Quote |
Chart |
News |
PowerRating)
Learn more strategies for trading stocks in the short term with a free trial to our PowerRatings! The highest rated stocks have outperformed the average stock by a margin of more than 14.7 to 1 after five days! Click here to launch your free PowerRatings trial today!
David Goodboy is Vice President of Business Development for a New York City based multi-strategy fund.
