Dow 11,000: Now What? Plus 3 PowerRatings Stocks
The Dow Jones Industrial Average eased above 11,000 yesterday for the first time in 18 months. Less than a month ago, we talked about a double top potentially forming at the previous yearly high of 10729.
Well, that technical pattern was shattered with the DJIA pushing ever higher. The index is now trading over 1000 points above its 200-day Simple Moving Average and about 450 points above its 50-day Simple Moving Average. Trend Followers would define this move as a massive uptrend while the reversion to the mean crew would say price is totally overextended on the upside.
Fundamentally, it appears that the fiscal stimulus packages have done their job. The economy is kicking into gear with mergers, acquisitions and take-over chatter happening almost daily. Corporate earnings are overall solid.
Even the earnings misses are being met with a positive outlook generally. The employment situation, housing and tight consumer credit remain as critical issues to be solved. The growing economy should rectify these situations, but it is going to take time.
Stocks are pulling back from the 11,000 level today. It’s important to keep in mind that stocks never go straight up. There is always an ebb and flow to every advance. We have quantified this phenomenon in individual stocks into an easy to use 3 step system.
The key is to locate those companies showing short term weakness, yet still in a longer term uptrend. We have developed an easy to use, 3 step system to help you locate shares ready for short term gains regardless of overall market conditions.
The first and most critical step is to only look at stocks trading above their 200-day Simple Moving Average. This assures that a strong, long term up trend is in place, increasing the odds that you are not buying into a falling knife or catching a stock in a death spiral.
The second step is to drill deeper into the list locating stocks that have fallen 5 or more days in a row or experienced 5 plus consecutive lower lows. Yes, you heard me right, fallen 5 or more days in a row. I know this is counter-intuitive of conventional wisdom of buying stocks as they climb higher.
However, our studies have clearly proven that stocks are more likely to increase in value after a period of down days than after a period of up days.
The third and final step is a combination of whittling the list down even further by looking for names whose 2-Period RSI (RSI(2)) is less than 3 (for additional information on this proven indicator click here) and the Stock PowerRating is 8 or higher.
The Stock PowerRatings are a statistically based tool that is built upon 14 years of studies into the inner nature of stock prices. It ranks stocks on a scale of 1 to 10 with one being the most volatile and least likely for short term gains and 10 proven to be the most probable for gains over the next 5 days. In fact, 10 rated stocks have shown to have a 14.7 to 1 margin of outperforming the average stock in the short term.
The stocks that fulfill each of the above steps have proven in extensive, statistically valid studies to possess solid odds of increasing in value over the 1 day, 2 day and 1 week time frame.
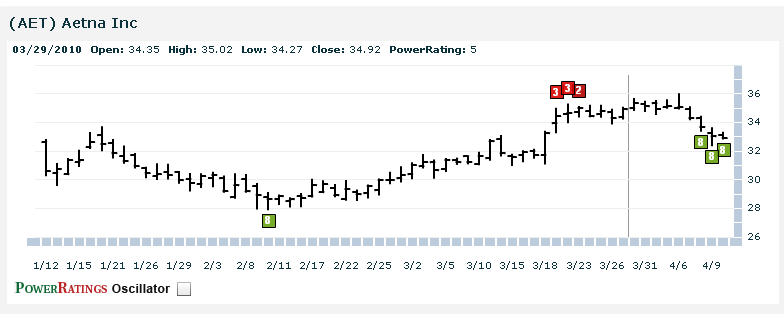
^AET^

^CLNE^
^RDY^
Learn more strategies for trading stocks in the short term with a free trial to our PowerRatings! The highest rated stocks have outperformed the average stock by a margin of more than 14.7 to 1 after five days! Click here to launch your free PowerRatings trial today!
David Goodboy is Vice President of Business Development for a New York City based multi-strategy fund.
