Down, Not Out: Four Big Pullbacks for Traders
When they’re cryin’ you should be buyin’, goes the old trading saw.
And the hits these four stocks have experienced in recent days mean
that there are plenty of teardrops — and opportunities — to go around.
Buying stocks after they have fallen by 5%, 10% or more is one of
the hardest things to do in trading from a psychological viewpoint.
But if your intent as a trader is to buy stocks when they are low and
cheap, and to sell them when they are high and expensive, then
learning how to buy stocks when everyone else is panicking is crucial.
Traders are never more bearish than they are when stocks have
fallen by 10% or more. But such moments are when true traders are
made, traders who are able to spot temporary weakness in otherwise
strong stocks and can back up that observation with the courage to
buy.
Our research looking at thousands and thousands of simulated,
short-term trades since 1995 has convinced us that the edge — again, in
the short-term — is in buying stocks that are down big rather than
selling them. We found that stocks that were in generally strong
shape (in other words, trading above their 200-day moving averages)
that suffered pullbacks of 10% or more over the past five days were
actually higher in one-day, two-day and one-week timeframes.
It is this kind of information that can make a world of difference
in terms of how traders, particularly short-term traders, approach the
stock market. Knowing that there is quantified evidence that says
traders should be bullish, not bearish, when stocks that are strong
experience pullbacks, is a powerful tool to help traders do the right
thing when the markets in general and stocks in specific experience
corrections.
Click here
to read our research into stock behavior after declines of 10% or
more.
Traders who are interested in learning more about how to trade the
way the professionals trade, buying weakness and selling strength, are
urged to join our TradingMarkets Path to Professional Trading, which
is currently teaching traders just how to deal with the large
pullbacks we have been experiencing in the market since October 2007.
Click here
to register. It’s free — and the best thing you can do today to make
yourself a better trader tomorrow.
Speaking of big pullbacks, here are four big pullbacks for traders
today. All of the four, with the exception of Mobile Telesystems OJSC
ADS, have PowerRatings of 8. I have also listed the 2-period RSI
(Relative Strength Index) values for each stock. The 2-period RSI is
powerful gauge of how overbought or oversold a stock is. The
TradingMarkets approach to trading the 2-period RSI looks for
instances when the indicator approach 98 in overbought markets and 2
in oversold markets.
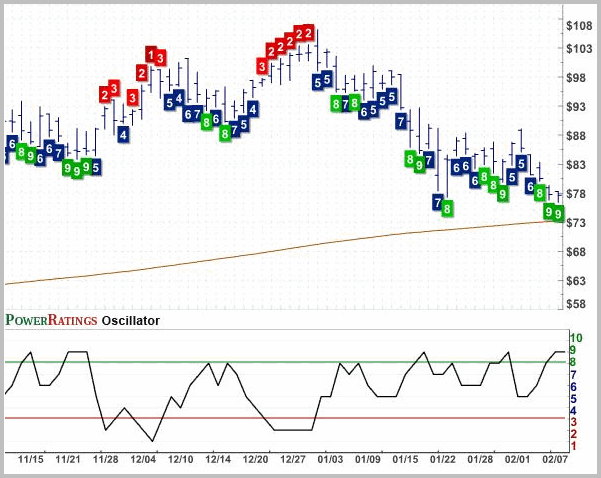
Mobile Telesystems OJSC ADS
(
MBT |
Quote |
Chart |
News |
PowerRating).
PowerRating 9. RSI(2) 4.18

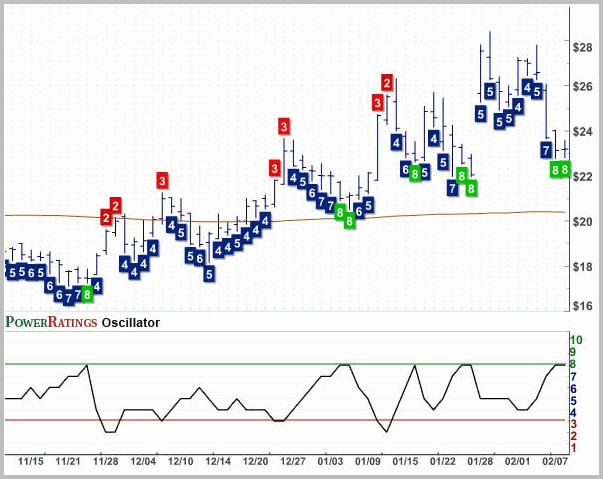
Acorda Therapeutics
(
ACOR |
Quote |
Chart |
News |
PowerRating). PowerRating 8.
RSI(2) 9.86

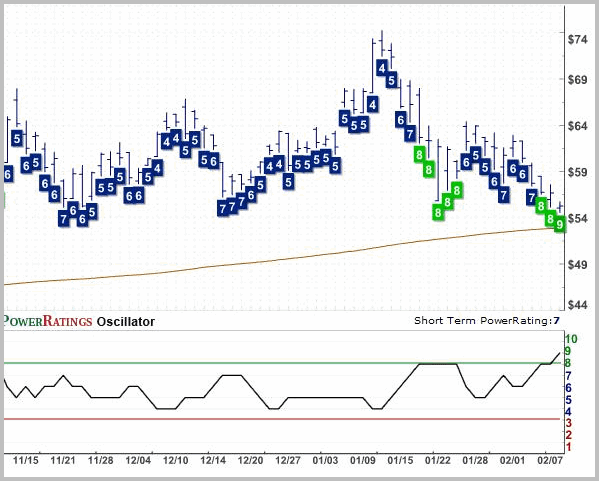
ICICI Bank Ltd. ADS
(
IBN |
Quote |
Chart |
News |
PowerRating). PowerRating 8.
RSI(2) 2.39

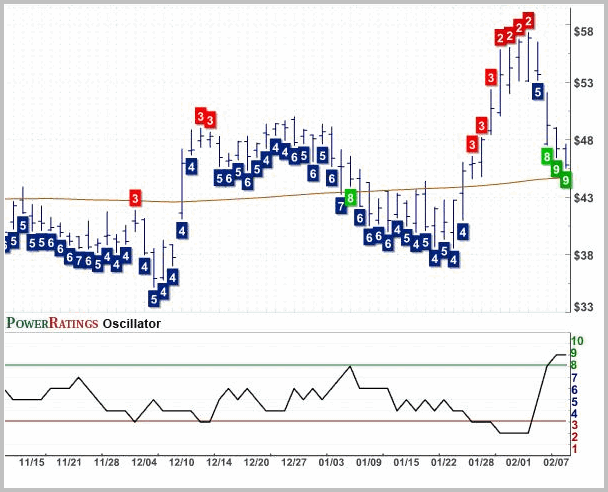
Bankrate, Inc.
(
RATE |
Quote |
Chart |
News |
PowerRating). PowerRating 8. RSI(2) 3.48

David Penn is Senior Editor at TradingMarkets.com
