Down So Long: 4 Oversold Stocks for Traders
When markets fall low and talk of panic is in the air, strong stocks that have been caught up on the selling frenzy often make for excellent opportunities to the long side for traders.
Traders talk a lot about oversold stocks. And when they do, most people think of technical indicators such as the stochastic and the Relative Strength Index. These technical indicators often do an excellent job of noting when stocks are oversold and, potentially, due for a bounce. We have enough confidence in
— and, importantly, experience with — indicators like the RSI to make it one of our TradingMarkets Stock Indicators.
Click here
to read our research into trading the 2-period RSI.
But oversold conditions can be seen in markets even if traders do not use technical indicators. All an oversold condition means is that a stock is experiencing a dramatic surplus in people wanting to sell the stock relative to the number of people who want to buy it.
Technical indicators show this in a variety of ways, but we can see the same basic scenario simply by looking at a price chart. If we see a market or stock that has fallen day after day after day, then we know that we are looking at a market that sellers have overwhelmed.
And just like at a retail outlet that is putting its merchandise on sale, buyers have a tendency to want to wait out the sale until they have a sense that prices have stopped going down before buying.
This thinking helped guide one of our other key TradingMarkets Stock Indicators, one that looks for stocks that have made five or more consecutive down days. Our research has found that stocks that are sold for five or more consecutive days actually produced positive returns in one-day, two-day and one-week time frames.
Why is this so? Have we not learned from trend trading that the trend is your friend until the end when it bends? Doesn’t that mean that stocks that are going down will continue to go down and should continue to be sold rather than bought?
While this can be true in the long-term, we have found that for the short-term trader the edge is in betting against markets that have gone to extremes
— such as having five or more days of selling in a row.
When we add the caveat that these markets must be in strong stocks, stocks that are trading above their 200-day moving average, we all but eliminate those “falling knives” that are down and truly headed nowhere but lower. Instead, we are often left with good stocks that have been irrationally and excessively sold by nervous, panicky investors.
Click here
to read our research into markets with consecutive down days.
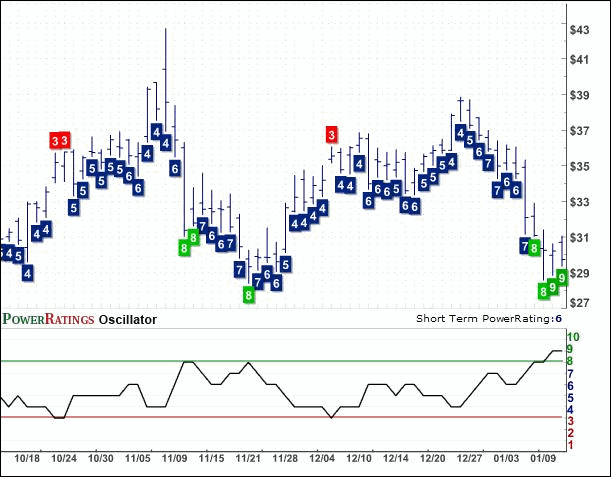
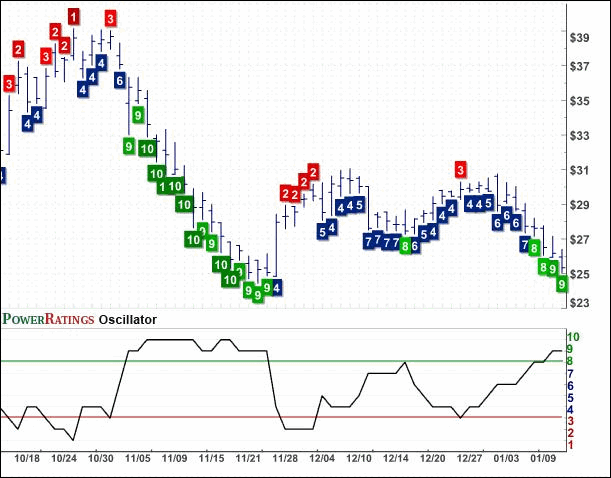
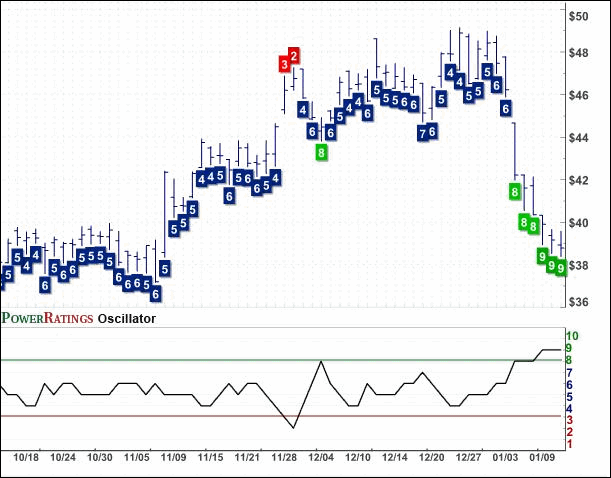
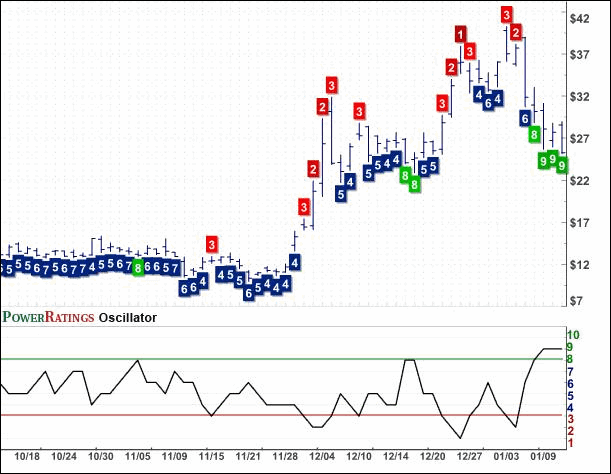
Below are four stocks that have been down five or more consecutive days. I have noted the 2-period Relative Strength Index to help confirm how oversold these stocks are (a 2-period RSI of less than 2 is concerned exceptionally oversold). I also included the 100-day historical volatility to help traders tell which stocks are more likely to respond powerfully from their oversold conditions (i.e., a higher 100-day historical volatility suggests a more powerful reaction).
Cypress Semiconductor
(
CY |
Quote |
Chart |
News |
PowerRating) PowerRating 9.
RSI (2): 1.50. H.V. (100): 53.10

Hansen Medical
(
HNSN |
Quote |
Chart |
News |
PowerRating) PowerRating 9. RSI
(2): 0.73. H.V. (100): 52.55

Rofin-Sinar Technologies
(
RSTI |
Quote |
Chart |
News |
PowerRating) PowerRating 9. RSI (2): 0.42. H.V. (100): 39.87

Solarfun Power Holdings
(
SOLF |
Quote |
Chart |
News |
PowerRating) PowerRating 9. RSI (2): 1.75. H.V. (100): 119.08

TradingMarkets PowerRating Charts are now
live! Click
here to launch them!
