Duration
After
the early gap up to 831.15 on the 9:35 a.m. ET bar, the
SPX
(
$SPX.X |
Quote |
Chart |
News |
PowerRating) reversed direction — what a surprise — from the intraday
low of 818.46 after holding above Tuesday’s 817.38 low. From there it was trend
up to 844.22 on the 2:35 p.m. bar, which is prime program time. It got choppy
into the close at 839.35.
Starting out this
morning, I see the S&P futures are +4, Dow +23, and Nasdaq +9 at 7:45 a.m. I
now go to the intraday five-minute chart of the SPX and see that the SPX closed
the day in a 1,2,3 lower top pattern. If the early green doesn’t hold, first
short entry is below 837.96, and then below the last swing point low yesterday
of 837.53. Next I Fib. out the numbers between yesterday’s 844.22 high and
818.46 low, so if the Program Gang shakes the tree, I know where I will look for
reversals after any pullback. If the early green holds and the SPX trades higher
than 844.22, I will redo the numbers to 818.46. There is plenty of
quarter-ending reallocation going on as the quarter ends on Monday, but most
activity will be today and Friday.
NYSE volume yesterday was
20% above average at 1.6 billion, with a volume ratio of 79, and breadth +1492.
We got the action from the sectors you were told to focus on: semis +7.0% and
biotechs +6.1%. I said a 10% move in the SPX would correspond to at least 20%
for the
(
SMH |
Quote |
Chart |
News |
PowerRating)s. So far, the SPX is +3.3% off the low, and the SMHs are +14%
in two days after having been the worst sector for the past two months. I guess
they weren’t on O’Neil’s or Edwards and McGee’s lists, but they sure should have
been on yours.
Duration of a move can’t
be known, especially with the ongoing Iraq situation, but we must live with that
until shown otherwise, and that means adjusting your trading style to these
short knee-jerk rallies and declines. The SMHs have had five rallies prior to
this one since the beginning of July, so I must be aware of what the duration
and percentage gain of those reflex rallies were.
Four of the five rallies
were between three and five days and the other was 13 days. The sequence was:
-
7/3 – 7/8, +17%,
three days. -
7/10 – 7/17, +18%,
five days. -
7/25 7/30, +14%, four
days. -
8/5 – 8/22, +32%, 13
days. -
9/5 – 9/11, +15%,
five days.
This rally is +14% and is
two days old. I also see the 20-day EMA for the SMH above at 22.26, which would
be +20% from the 18.60 low.
The short story is if you
bought the SMHs early, and most of you don’t, it means you probably should have
sold some of your position into yesterday’s move, leaving yourself with 75% of
the position to trade, seeing that yesterday was a Change in Direction day,
closing in the top of the range above the previous day’s high and the previous
two closes. I wouldn’t buy any opening gap in SMHs and prefer to wait for a
pullback entry setup and/or second-time-through trade above yesterday’s high if
the rally even continues.
For the SPX, I see that
the .50 retracement between 965 – 776 is 870.50, the 20-day EMA is 873.56. From
the 817 low to this zone is about a +7.0% move for the SPX. It should also be
noted that the .382 retracement is 848. Make sure you check my stock screens
today, and concentrate where the volume occurred yesterday, and of course, your
primary focus is on semis and biotechs BOTH ways.
Have a good trading day,
and I will be out of the office tomorrow, so have a great weekend.
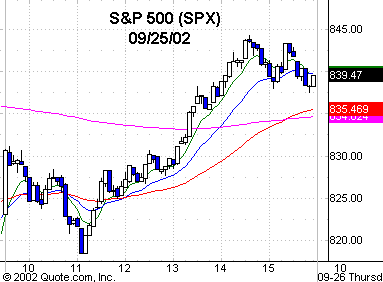
Five-minute chart of
Wednesday’s SPX with 8-, 20-,
60- and 260-period
EMAs
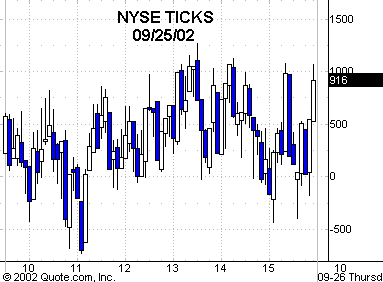
Five-minute chart of
Wednesday’s NYSE TICKS