Dynamics And Relationships
Yesterday’s trading session was not unlike any previous trading sessions.
We again had limited volatility on the open, which was tradable, but not without
restraint. Midday trading was virtually nonexistent, then Uncle Al provided some
afternoon volatility with his International Economic address. The topic I want
to address this morning is understanding market dynamics and relationships.Â
Volatility, as mentioned
above, was not there to warrant any HVT trades on the open. There were
opportunities along the lines of taking a position in the market, rather than
trading volatility breakouts, as the column has been referring to over the last
few weeks.Â
One such trade I took on the
open yesterday morning in the QQQs will illustrate this point. The key to this
trade was understanding the market dynamics and relationship. The S&Ps sold off
to 893, found a bottom five minutes into the session, then rallied up to 899.
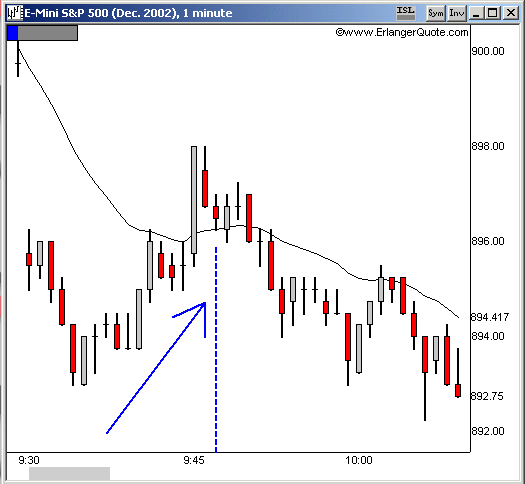
Take a look at the SOX at
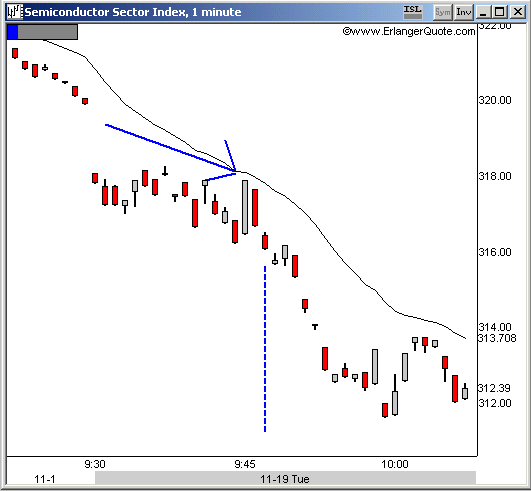
this time…downtrending during a 5 point S&P rally! The SOX lately has led this
market around by the hand. You have to be aware of this and realize that a
broader market rally will probably not go too far without the chips. Note the
dotted blue line in the SOX denotes a low on the day in the SOX, while the S&Ps
just pulled back from the highs…a huge divergence.
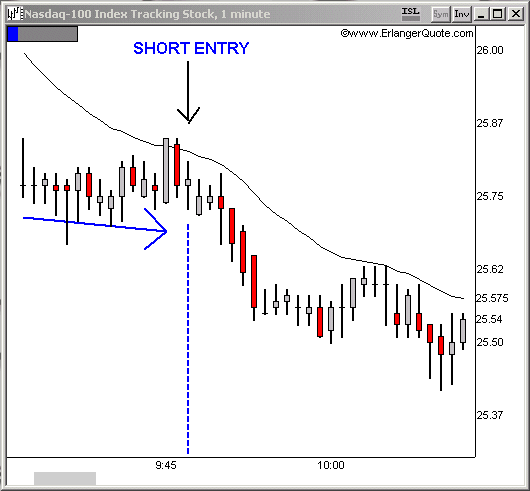
I knew this and was ready to
get short the QQQs as soon as the S&P rally lost steam. Sure enough, at 9:50
a.m., the S&Ps lose the juice and what happens next…the NAZ/QQQs/SOX take a
hold of this market and we sell off. I went short the QQQs at 9:48 at 25.75 as
soon as the S&Ps rollover (dotted blue line)…and still uptrending. The NAZ
rolls over and leads the market, S&Ps, lower.
Â
As predicted, the weak SOX carried the market lower. I then was looking to lock
in some profit in my trade, not because the SOX/NAZ was running out of the
juice, but because the S&Ps were gaining strength in the form of a 1,2,3-style
higher low.
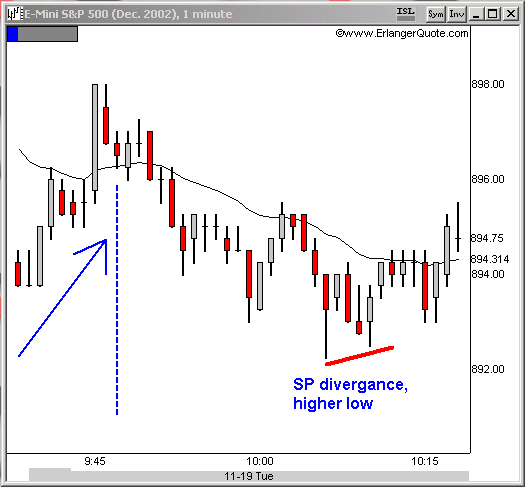
The NAZ, however, continued
to make lower lows, note the red divergence lines. I covered half of my trade at
9:54, a quarter on the divergence at 10:11, and let the last quarter ride to be
stopped out at 10:18.Â
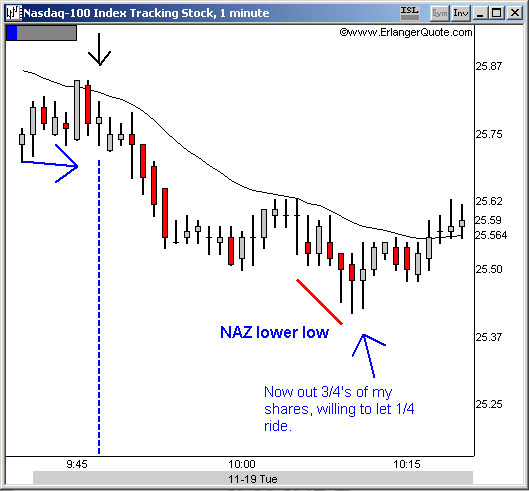
So, a
divergence got me in the trade, and a divergence got me out of the trade. The
S&P/NAZ divergence at the bottom allowed me to cover a portion of my short
within 4 cents of the low on the morning. Understanding how the different market
components interact with each other will allow you to have an insight into the
workings of market relationships.
Key Technical
Numbers (futures):
S&Ps |
Nasdaq |
| 922 | *1066.50* |
| 912 | 1059.25 |
| 909 | 1042.75 |
| 906 | *1035* |
| 897 | 1026.25 |
| *892* | *1018* |
| 887 | 1002 |
| 882 | Â |
Todd
