Earnings Game In Focus
What Tuesday’s Action Tells
You
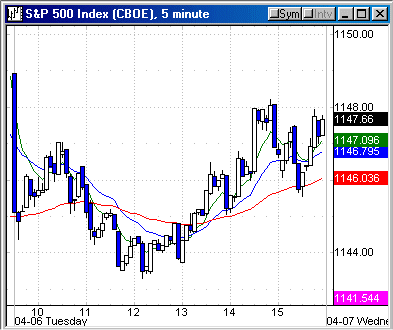
The major indices drew a line yesterday, going
sideways after the gap down opening. It was not a trader-friendly day if you
trade the futures or index proxies. The market action was simply gold (XAU),
+0.6%, bonds,
(
TLT |
Quote |
Chart |
News |
PowerRating), +0.6%, and Basics (XLB), +0.5%, up with technology
and
small caps down. The
(
SMH |
Quote |
Chart |
News |
PowerRating) was -2.2%, the
(
QQQ |
Quote |
Chart |
News |
PowerRating) -1.3%, XLK -1.0%,
SWH
-1.1%, Nasdaq
(
$COMPQ |
Quote |
Chart |
News |
PowerRating) -0.9% and the IWM (Russell 2000) -1.2%. The
SPX
(
$SPX.X |
Quote |
Chart |
News |
PowerRating) and Dow
(
$INDU |
Quote |
Chart |
News |
PowerRating) were just chop at -0.2% and +0.1%,
which
tells you nothing.
NYSE volume was 1.39 billion following
Monday’s
1.4 billion, both below the last four weeks’ 1.46 billion average. The
volume
ratio was 38 with the 4 MA now 60 and has been greater than 60 for six
straight
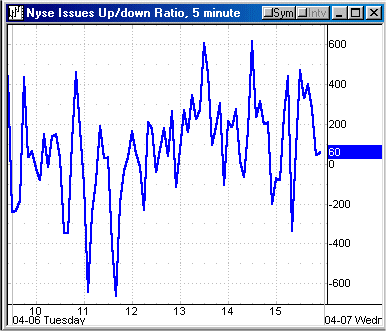
days into the end-of-quarter and April new money allocation. Breadth
was -922
yesterday with the 4 MA now just +4, and this divergence has to be resolved
or
sideways will prevail a few more days for the major indices and
HOLDRs.
Yesterday’s opposite day follows the eight-
to
nine-day rally from the initial retracements for the major indices and
HOLDRs,
so there is no surprise there, in addition to the SPX back to the 1150 –
1161
resistance zone that provided some good short side trades and adjustments in
options strategies.
It’s the media’s time to babble at a high
pitch
with the earnings game in focus again. Comparisons are very easy coming off
a
weak first quarter last year for most companies. The hedge funds will
exploit
this for sure if the current Iraq and terror negative events don’t
overshadow
it. The market risks have increased significantly as price and valuations
are
extremely high, and also by the time factor that has elapsed from the
October
2002 low. This corner doesn’t expect, at best, any more than another +8.0%
above
the 1163 SPX high into the 1254 .618 retracement zone to 1553 before a
decline
into 2006. That is the current framework for this corner’s strategies,
whether
it be synthetic straddles or selling out-of-the-money premium against the
LEAP
calls that replace the index proxies. This rally has not only provided
adjustments to the straddles, but it has also set up the third month of
selling
out-of-the-money premium at good levels. Both positions will allow one to
participate in any more upside.Â
| Â | Wed. 3/31 |
Thurs. 4/1 |
Friday 4/2 |
Monday 4/5 |
Tues. 4/6 |
Index |
 |  |  |  |  |
| SPX |
 |  |  |  |  |
High |
1130.83 | 1135.67 | 1144.81 | 1150.54 | 1150.57 |
Low |
1121.46 | 1126.20 | 1132.17 | 1141.64 | 1143.30 |
Close |
1126.21 | 1132.17 | 1141.80 | 1150.54 | 1148.17 |
% |
-.07 | +0.5 | +0.9 | +0.8 | -0.2 |
Range |
9.4 | 9.5 | 12.6 | 8.9 | 7.3 |
% Range |
50 | 63 | 76 | 100 | 67 |
INDU |
10358 | 10373 | 10471 | 10558 | 10571 |
% |
-0.2 | +0.2 | +0.9 | +0.8 | +0.1 |
Nasdaq |
1994 | 2015 | 2057 | 2079 | 2060 |
% |
-0.3 | +1.0 | +2.1 | +1.1 | -0.9 |
| QQQ |
35.84 | 36.16 | 37.10 | 37.45 | 37.00 |
% |
-0.2 | +0.9 | +2.6 | +0.9 | -1.2 |
NYSE |
 |  |  |  |  |
T. VOL |
1.47 | 1.52 | 1.61 | 1.40 | 1.39 |
U. VOL |
819 | 1.04 | 1.10 | 894 | 531 |
D. VOL |
614 | 472 | 493 | 485 | 846 |
VR |
57 | 69 | 69 | 65 | 38 |
4 MA |
68 | 71 | 67 | 65 | 60 |
5 RSI |
67 | 74 | 81 | 85 | 79 |
ADV |
2029 | 2174 | 1752 | 1538 | 1200 |
DEC |
1263 | 1121 | 1573 | 1832 | 2122 |
A-D |
+766 | +1053 | +179 | -294 | -922 |
4 MA |
+923 | +1114 | +774 | +426 | +4 |
SECTORS |
 |  |  |  |  |
SMH |
-0.1 | +1.6 | +3.2 | +1.2 | -2.2 |
| BKX |
-0.3 | +0.7 | -1.2 | +0.5 | +0.3 |
XBD |
+.05 | +1.2 | -0.1 | -0.5 | -0.3 |
RTH |
+0.1 | -0.9 | +0.1 | +0.9 | +0.4 |
CYC |
-0.1 | +0.8 | +1.6 | +0.4 | -0.4 |
PPH |
+0.4 | +0.9 | +1.1 | +0.9 | -0.4 |
OIH |
+0.5 | -2.7 | +0.8 | +0.4 | -0.8 |
| BBH |
-0.6 | +1.9 | +2.1 | +0.2 | -1.1 |
TLT |
+0.5 | -0.3 | -2.5 | -0.8 | +0.5 |
| XAU |
+0.4 | +0.4 | -1.0 | -2.4 | +0.6 |
 ^next^
For Active
Traders
As you can see on today’s charts, the SMH
rallied
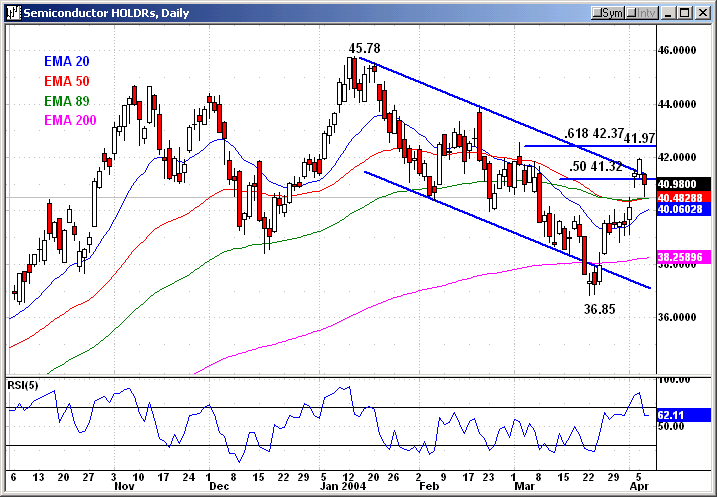
to 41.97 and closed back inside the channel yesterday at 40.98. The current
retracement zone is 41.32 – 42.37, so you have that to work against on intraday
short setups. On the downside, we are working the 40 – 40.50 zone for any long
intraday reflex if it goes red. Only one day down after 10 up is not enough
breathing room, so tight stops on intraday long scalps in the SMH. The
closing
range breakout above 41 puts the SMH above all of its intraday EMAs.
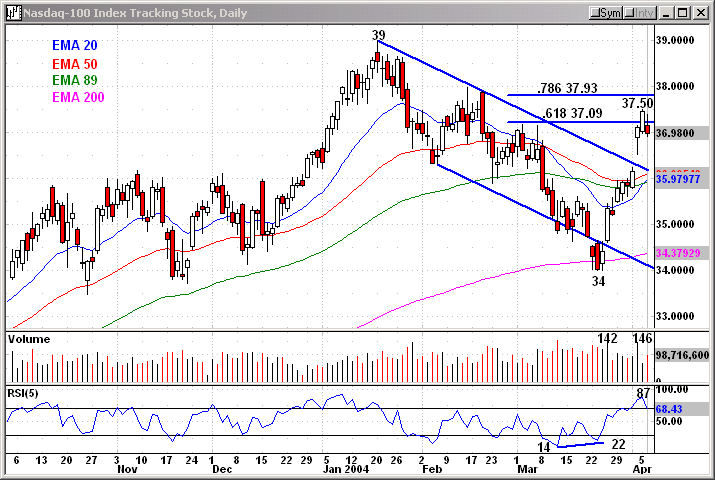
The QQQs have a price action retracement zone
in
play from 37.09 – 37.93, with 36 – 36.50 as your intraday lower zone in
play.
The markets are closed Good Friday, so you could be looking at some strange
price reactions today and Thursday on lighter volume in many cases. There
will
be specialists and market makers that take a longer holiday, and the rookies
will be on the books with explicit instructions to let the stock go where it
wants to go and don’t take any position shots while trying to keep the
position
flat into the weekend. The aggressive hedge funds thrive in these
situations, as
it is easier to bully the stock in either direction. Today and Thursday
there
will be better intraday opportunities in individual stocks, just as it was
yesterday, so keep scrolling.
Have a good trading day,
Kevin Haggerty


