Enough Bellyaching
While
the market avoided another plunge to new lows, surely setting off
another round of selling, the S&Ps and Nasdaq managed to put in a good
performance after breaking below yesterday’s close, re-testing, then closing
just above their 15-minute moving averages. From
purely a “box score†standpoint, a decent day.
What was troubling was the lack of participation in individual issues.
Most of the usual “scalping†stocks were lifeless, failing to follow
the futures on moves up or down. Part of
the problem is simply due to typical summer trading, although there may be other
forces at work.
I talk with several traders
each day, traders who I have known and respect, and their overall assessment is
one of frustration. The market is simply
grinding in any one direction, then grinds the other way.
There are no quick, decisive moves which offer short-term traders like
ourselves “ideal†setups. But enough
of the bellyaching. We should be thankful
that there is at least movement intraday. It
could be worse. We could be transported back in time and forced to trade the
markets of the early 1970s, when not only was there limited intraday range, it
was compounded by the fact that everyone was wearing bell bottoms.
Like all professional traders,
you must adapt. Last August I was forced
into the same situation, and it appears I will be again.
My solution is really quite simple; extend your time frame.
Rather then identifying setups on a one-minute chart, I simply look for
the same setups on a five-minute chart. Given
that the intraday moves are taking longer to develop, and tend to be a bit more
orderly, it is a logical alternative. Additionally,
you will save yourself from getting chopped up and spending a lot on
commissions. Make no mistake, this
approach does not make it any easier, and in some respects, it makes it more
difficult. Anytime you extend your time
frame of prediction, you greatly reduce your odds of being correct in the short
run. Let’s take a look at what I am
suggesting.
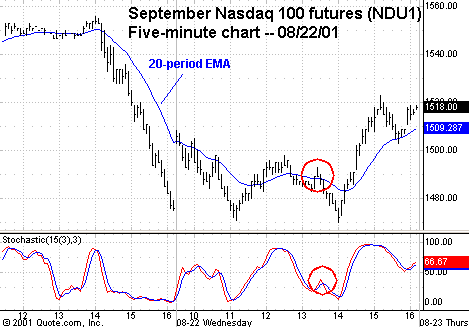
Chart #1 is a five-minute chart
of the Nasdaq futures. The trend is down, as noted by the downward sloping
moving average. My goal here was to get short into countertrend rallies into
that general area. At 13:25 EST, the futures broke briefly above the 20-period
MA, then traded back through, which was confirmed by a simultaneous stochastic
cross.

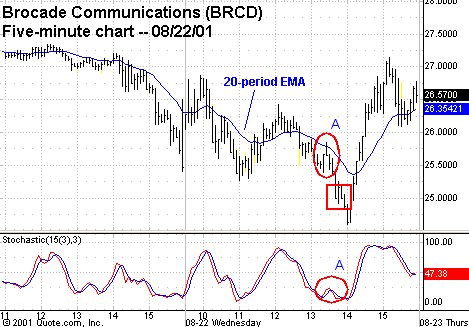
Chart #2 exhibits
the same pattern, this time on a stock that closely follows the Nasdaq futures,
Brocade
(
BRCD |
Quote |
Chart |
News |
PowerRating). I was able to initiate a short on this move and take advantage
of the move to the downside. I did cover half of the position in the area
denoted by the square simply because of the the one-bar reversal at 13:40 EST.
The rest was covered on the next one-bar reversal at 14:05 EST.

As you can see, the duration of
my trade was much longer than normal. However, given the choppy state of the
market, it is a logical alternative. Some of you will probably ask: “Why
didn’t you go long after covering and take advantage of the move to the
upside?” Good question. Some traders may have, and that suits their style
and methodology. My number one rule, as you know, is to trade with the trend. At
the time, the trend was still down. The trend was not reversed until 14:35, as
denoted by the now upward sloping MA. It is always really easy to read the
charts from right to left and draw the obvious conclusions. Trust me, at the
time, going long did not seem like a good trade.
Key Technical Numbers:
(futures)
| S&Ps |
Nasdaq |
| 1180.67 | 1573 |
| 1175.47 |
1560 |
| 1173 | 1537 |
| 1164.67 | 1504 |
| 1158 | 1493.5 |
| 1155.5 (contract low) |
1484.33 |
| 1148 (confluence number) |
1470 (contract low) |
| 1132 | 1450.67 |
As always, feel free to send me
your comments and questions. See you in TradersWire.
