Erratic Price Action Means Shorter Time Horizons
The energy stocks gapped up on the opening and
never looked back, with the
(
OIH |
Quote |
Chart |
News |
PowerRating) finishing +5.6% and XLE +3.6% as crude oil
shot up +2.7% along with more London terror news. At the same time, the SPX
(
$SPX.X |
Quote |
Chart |
News |
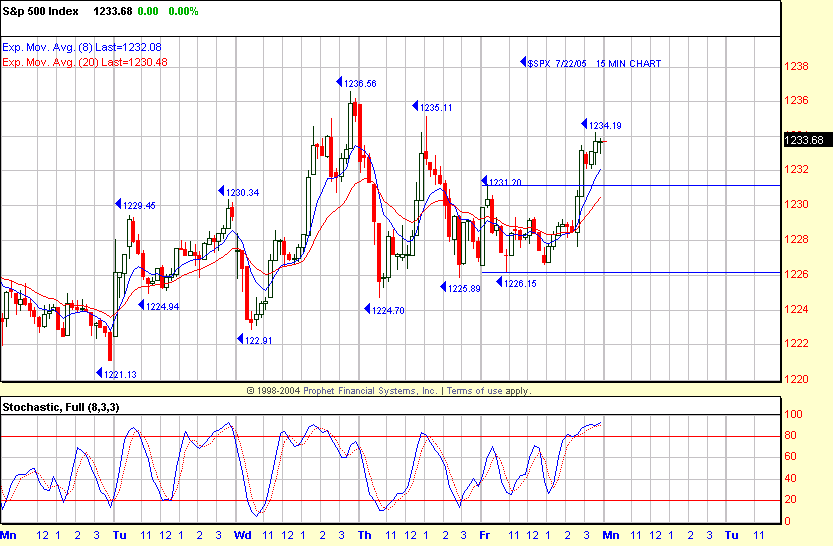
PowerRating) did basically nothing all day up to that point and was locked in
a 5-point range between 1231.20 – 1226.15 until the convenient 2:40 p.m. ET
breakout from 1229 to the 1233.68 close (+0.5%). Certainly a trend is
developing, with the SPX rallying vs. negative terror news, and in my humble
opinion, is no accident. A senator made a comment on TV the other day that “we
will not allow the terrorists to hurt our markets.” What does that mean? That
the Plunge Protection Team is active and stabilizing our market just as they did
in 1987, 2001 and earlier this year, let alone whenever else? That stabilizing —
in addition to the actual Generals’ buying/selling every day, not to mention
programs — makes for some very erratic and strange price movements, so traders
must be very nimble and control risk. No heroes, please.
The Dow
(
$INDU |
Quote |
Chart |
News |
PowerRating) finished at 10,561, +0.2%,
the
(
QQQQ |
Quote |
Chart |
News |
PowerRating) 39.42, -0.1%, and Nasdaq
(
$COMPQ |
Quote |
Chart |
News |
PowerRating) was flat at 2180. NYSE
volume was only 1.34 billion shares, with the volume ratio 68 and breadth +1155.
The sectors were all green except the PPH, which closed -0.1%. The energies led,
as previously mentioned, followed by the XBD and RTH, both +0.7%. The TLT (bond
proxy) gained back +0.8% from the -1.4% day on Thursday.
As I prepare this commentary on Saturday for
Monday, there has been another fatal terror attack, this time in Egypt, so the
Monday price action might be erratic depending on further development, but that
means there will probably be more stabilizing by the PPT on weakness, which can
possibly get the SPX once again heading to that 1254 – 1310 zone. The recent TLT
weakness should be watched closely with the rising wedge for the $HGX
(Philadelphia Housing Index). A downside move in both the TLT and $HGX will be a
major negative for equity markets. There are certainly negative divergences
currently in the $HGX. The TLT had advanced +28% from 75.72 (08/11/03) to 97.00
on 05/30/05, closing Friday at 93.55. The rising 40-week EMA is 91.05. The next
minor Fibonacci time ratios are 07/27/05 and 08/03/05.
Have a good trading day,
Kevin Haggerty
P.S. I will be
referring to some charts at
www.thechartstore.com in the future.

Â
