ES Game Plan
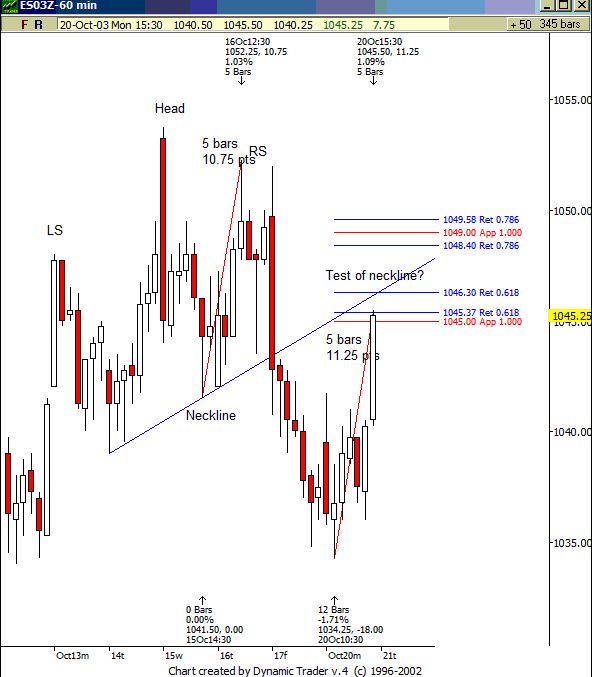
A critical zone to be watching
off of the 60-minute chart in the S&P Eminis (ESZ3) is from 1045-1050.
Here’s what I see:
1) We sold off late last
week off of a Head & Shoulders Pattern. You can see in the chart below where
the neckline was violated and price continued to the downside.
a. Today we rallied up and testing the neckline that we just punched down through.
2) Interesting enough…the previous rally from October 15 to 16 was 5 bars
10.75 points. Today’s rally to test the neckline is now at 5 bars and
11.25 points. That’s what I call a symmetrical countertrend rally (counter
to the immediate trend since Oct. 14 which is down).

3) As ES tests this Fibonacci
price resistance zone and neckline, I’m looking for triggers to short.
a. If triggered short, I’m placing a stop above 1050.
i. If no trigger and ES continues above 1050, I vote for a momentum type move
that takes us up to 1060 to 1070 pretty quickly.
Have a great night!
derrik@fibzone.com
