ETF PowerRatings Strategies for Traders: Quantified Edges in Top Rated Funds
With the markets selling off aggressively on Thursday, the number of top-rated ETFs – ETFs with ETF PowerRatings of 9 or 10 – has virtually exploded. As of the Thursday close, our database spotted 26 exchange-traded funds with these top ratings of 9 or 10.
In my last ETF PowerRatings column, I noted that – as is the case with high probability ETF trading in general – country-based ETFs tend to outperform most other types of ETF – especially commodity ETFs. This is why I highlighted ETFs like the iShares FTSE/Xinhua China 25 ETF
(
FXI |
Quote |
Chart |
News |
PowerRating) and the iShares MSCI South Africa Index Fund ETF
(
EZA |
Quote |
Chart |
News |
PowerRating).
But that does not mean that other ETFs that are based on sectors cannot be excellent trades. Our research into short term ETF price behavior going back to 2003 indicates that those ETFs that have earned our highest rating of 10 have made gains 80% of the time in the short term. And this includes a large number of sector ETFs, as well as country and equity index ETFs.
Click here to launch your free trial to our new ETF PowerRatings!
Today, let’s look at some of those sector ETFs that have earned ETF PowerRatings upgrades to 9 or 10. Continued weakness in the market will only cause these ETFs to pull back even further, offering potential opportunities for PowerRatings traders to enter positions at very low, extremely oversold levels.
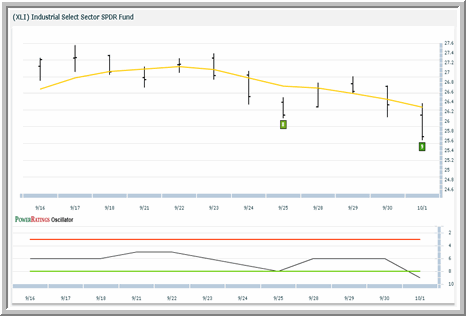
Down three days in a row leading into Friday and closing lower for six out of the past seven trading days, the Industrial Select Sector SPDR ETF
(
XLI |
Quote |
Chart |
News |
PowerRating) has earned an ETF PowerRating of 9 (see below).

As of the Thursday close, XLI had a 2-period RSI of less than 8. It is the second most oversold reading in the ETF in the past month.
Another source of recent weakness from a sector perspective is the pullback in the SPDR Dow Jones International Real Estate ETF
(
RWX |
Quote |
Chart |
News |
PowerRating).

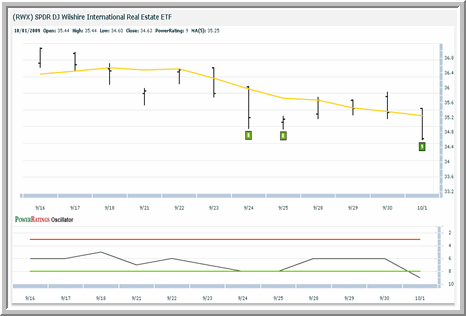
Like XLI, RWX has closed lower for the past three days in a row, becoming exceptionally oversold above the 200-day moving average. As of the close on Thursday, RWX had earned an ETF PowerRating of 9 and has a 2-period RSI of less than 8 – its lowest level since September 1st.
Lastly, I can’t resist including a country ETF. So let’s take a quick look at the Vanguard European Stock ETF
(
VGK |
Quote |
Chart |
News |
PowerRating).

VGK includes widely-traded European stocks like Total S.A. and GlaxoSmithKline among its holdings, and is a way for traders to get significant exposure to the stocks of “the continent”.
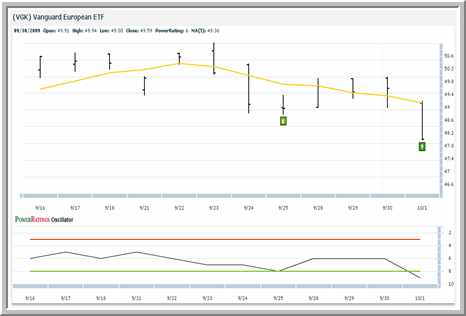
And as of the Thursday close, the stocks of “the continent” had pulled back significantly. As measured by VGK, European shares have fallen for three days in a row, with VGK closing at its lowest level since early September. With an ETF PowerRating of 9, VGK has a 2-period RSI of approximately 8.
Our highest rated ETFs have produced positive returns in the short term more than 80% of the time since 2003. Click here to start your free trial to our new ETF PowerRatings today!
David Penn is Editor in Chief at TradingMarkets.com.
