ETF Trading Strategies, the 200-Day Moving Average and the End of the World
Has the recent pullback encouraged you to second guess your trading strategy?
In this morning’s Larry Connors Daily Battle Plan, the daily, high probability short term trading advisory service run by Larry Connors, founder and CEO of TradingMarkets and Connors Research, Larry pointed out how the recent pullback brought out more than the usual number of “end of the world prognosticators”.
Said Larry: “With the markets moving higher for five days in a row and looking to open up overbought again today on Monday, it may be that those prognosticators will need to polish their crystal balls.”
Click here to learn how to utilize Bollinger Bands with a quantified, structured approach to increase your trading edges and secure greater gains with Trading with Bollinger Bands® – A Quantified Guide.
No one knows what the markets will do over the next few days or weeks. But one of the benefits of using quantified trading strategies when you trade is that you don’t need a crystal ball to forecast the future of stocks and exchange-traded funds (ETFs). By sticking with backtested trading strategies that have shown positive, robust results in the past, traders can trade with the positive expectation – not illusory predictive power – that over time, more trades will be winners than losers.

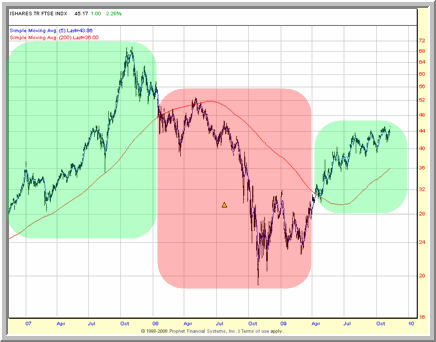
Figure 1. ^FXI^. The two green areas highlight when the ETF is in a bullish mode and trading above its 200-day moving average. High probability trading strategies call for staying on the long side of the market when the ETF is above its 200-day moving average.
And for traders using high probability trading strategies – including our ETF PowerRatings trading strategies – those trades that turn out profitably is likely to dwarf those trades that do not.
Click here to learn more about how to trade ETFs using our ETF PowerRatings!
For those traders who are still a little panicked about the recent downturn and can’t help but want to know the future, here is the high probability trading’s next best thing to a crystal ball: the 200-day simple moving average.

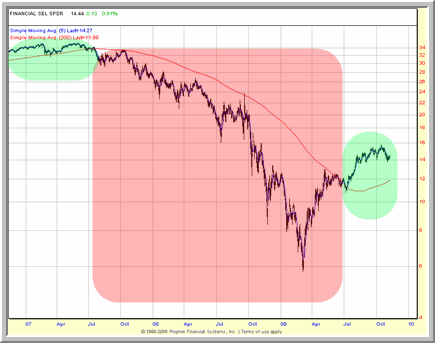
Figure 2. ^XLF^. Once an ETF drops below its 200-day moving average, high probability ETF traders don’t need a crystal ball to know that is smart strategy to stay on the sidelines – or trade to the short side – until the ETF rallies back above the 200-day.
There may be no more “boring” moving average than the 200-day simple moving average. Compared to its flashier counterparts – especially the 20- and 50-day versions often goosed with exponential or even triangular/weighted calculating tactics – the 200-day simple moving average can be easy to forget about. But in our testing, it is one of the most important barometers of a market’s health.
As we have shown in studies using equity indexes, stocks and ETFs, markets that pullback above the 200-day moving average tend to rally after becoming oversold. Rather than signifying the end of the world, pullbacks above the 200-day, according to our research, are opportunities.
So the next time someone tells you that the stock and ETF world is going to hell in a handbasket, check your charts. If the stock or ETF in question is trading above its 200-day moving average, then feel free to politely ignore them and continue on your high probability trading way. You’ll have decades of quantified research behind you and your trading while others are preoccupied fretting over the latest prognostications of the guru-du-jour.
David Penn is Editor in Chief at TradingMarkets.com.
