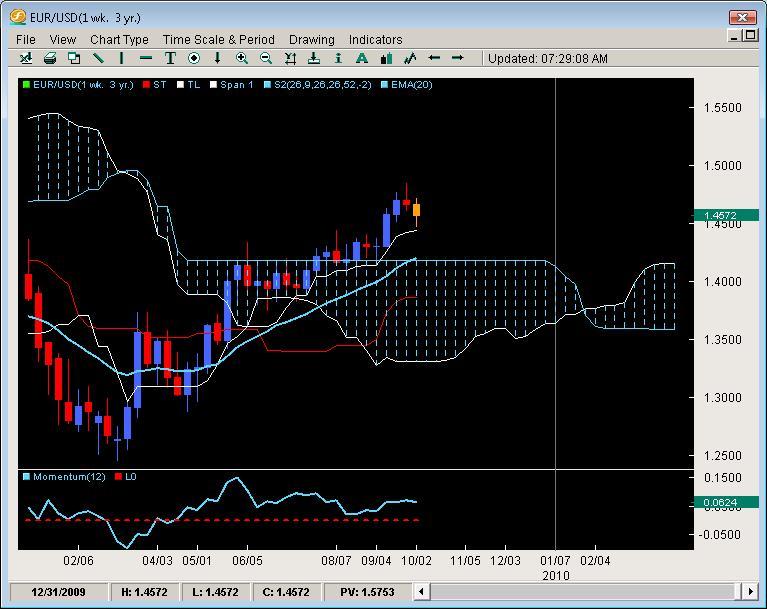
EUR/USD Has Posted Closes Above the Weekly Ichimoku Cloud
EUR/USD
For 11 weeks now, the EUR/USD has posted closes above the weekly Ichimoku Cloud and consequently, all of them have been above the Tenkan (white line).Interestingly enough for this trader, that line comes in at the previous breakout level of 1.4450ish and also the 38.2% fib of the last major upswing after the summer consolidation from June to August. We feel this should provide an interesting test and could be a reasonable place to park some light longs (reasonable as in not betting the farm but taking some of your Vegas winnings and playing a hand). If it gets there violently to start the week, then we will want some assurance it will hold looking for a day or several 4 hour candles holding there with no closes below that level by more than 30pips. Any 4 hour or daily closes below the 1.44 handle suggest the 2nd fib is under attack at 1.4300 and may test the confidence of the bulls giving them pensamientos.
While the 20ema and 61.8% defenses should hold better than the persian forces at Guagamela facing a young general named Alexander, we also want to note the Kumo formation. Notice the long weekly flat Senkou Span two at 1.4160. This flatness could attract price action towards it as it may want to equalize before 2010. This formation is not the typical formation for a massive bull run so one may want to reconsider putting heavy longs on the EUR/USD as it may want to move towards that before starting another run. Momentum is still at high levels suggesting there is some internal strength for the pair but this would not be our front-runner pair for being bullish – a contender at best and more likely in the vein of a Sunday Argentinian casual saunter with the family (having frequent stops for window shopping and getting the kids back in order).
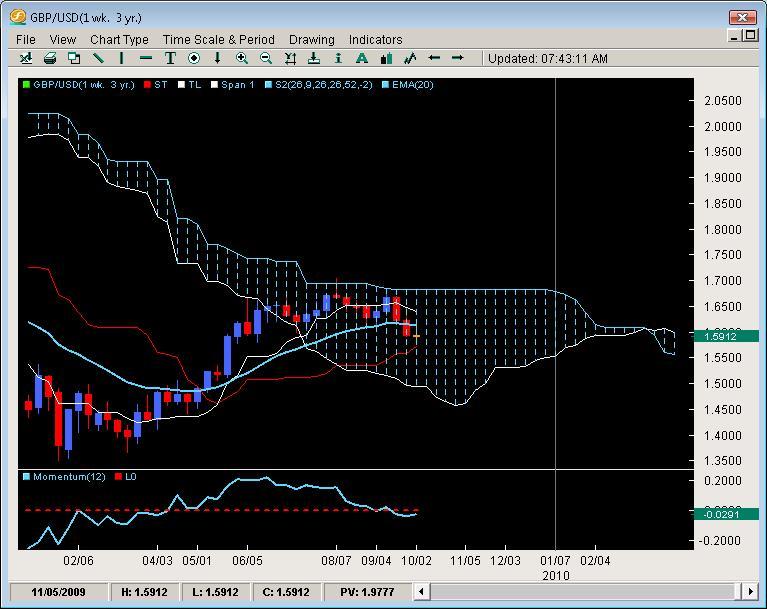
GBP/USD
One of the weaker pairs against the greenback in 09, this pair has yet to have anything meaningful above the Kumo other than a brief flirtation above it like the Groundhog coming above the surface on a cold day or one’s first kiss in the summer of 7th grade – not holding much importance these days.
The vultures are not thinking their meal is coming soon but they are circling the pair as another meltdown may be underway. At best, the scenario looks as complicated as it would to a 1650chess rated player on the opposite side of the board from Gary Kasparov (for the record, my highest rating in tournament chess was 1830, but that was over 9 years ago and the last random person I played, I lost to at a street game in N.Y.C. – a tall bald guy 6’3 and over 200lbs who I found out later learned chess in prison so there was an intimidation factor that likely affected my psychology during the game – just for the record). Back to the business of kings and queens in the currency world, the Pound will have to put on a new pair of clothes to establish any real horns and if its going to put on any costume, the bear claws seem more available (like in the top drawer) than the bulls horns (stuck in the dusty attic) as it currently sits below the Tenkan and 20ema. With the cloud formation flipping and looking rather anemic, we expect a less than committed future for the pair but better than say Jon and Kate + 8.
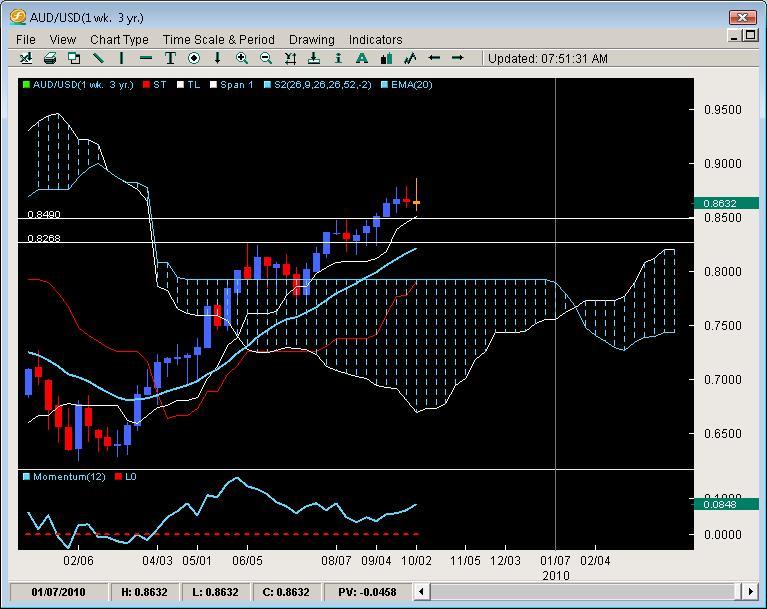
AUD/USD
After enjoying a relatively care free-uptrend, the pair has now posted two weekly losses – albeit small, mild and timid in nature like the Congos (monkeys in Spanish) I saw in the Nicaraguan forests. After piercing the cloud for the 2nd time, the pair has marched in blitzkreig fashion towards the 9000 barrier only to come up shy 130pips before the big figure. What is interesting to note is the last three weekly candles have all closed at relatively the same place as they opened the week, almost as if the breaks were being applied before considering whether to turn left or right at Albuquerque. Momentum is divergent but still showing upside can be had with a decent effort. Buying on breaks has not been the play for the last three weeks so we prefer dips to 8500 and 8300 before establishing any more longs but overall, we like the AUD vs. the USD in the medium and long term and could easily envision an even parity against the USD in 2010.
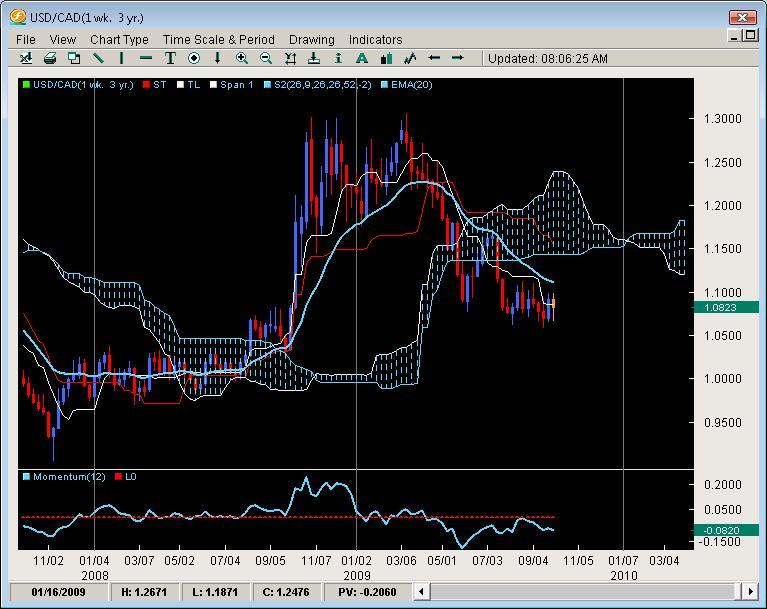
USD/CAD
Below the Kumo and 20ema, the latter since mid April, the pair has had resurgences, only to get stymied by the 20ema. Lately its been drifting down at a non-chalant pace hovering around the 1.06-1.10 region with no real commitment other than to be caught in the decision making process like a shopper at Ikea. Overall, we feel the only real plays are rejections off the 20ema until we see further commitment on one side of the market or the other. Kumo formations suggest the best time for a reversal would be the end of year, new year when traders are on vacation. Beyond that, with no major upside thrusts in the near term, our forecast is for the pair to remain below 1.15 till the end of the year. Beyond that, there isn’t much interesting about the CAD yet but it has the potential to go from slumbering bear in winter to rattlesnake shaking its tail ready to strike and move fast.
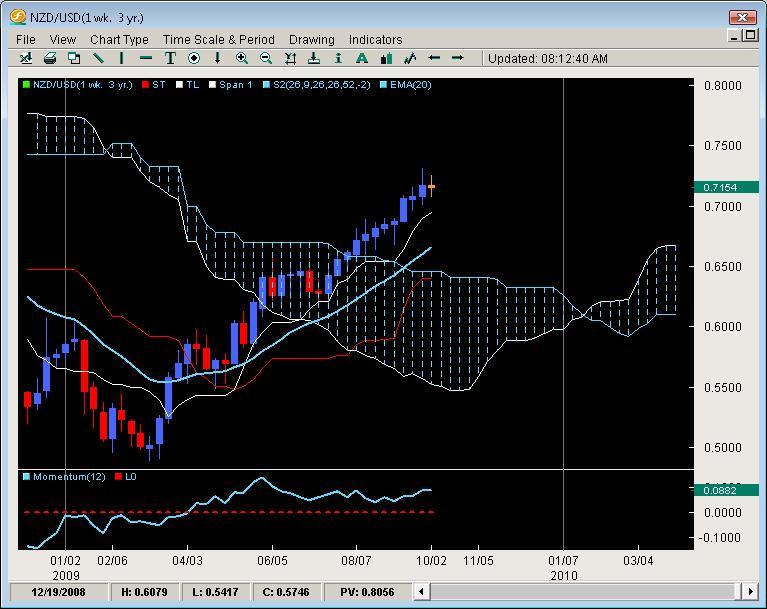
NZD/USD
The only pair to manage an 11week move in one direction (north in case you were wondering) finally saw the streak end before the dirty dozen was hit. Another interesting note about this pair is its the only one to break the Kumo without doing a Baskin Robbins double dip into the kumo, clearing the top and marching to a consistent tune towards the upside. The last week created a doji and inside bar so we really feel any plays inside this bar would not be advisable. Dips to the Tenkan or 20ema suggest promise as long as they do not get their in a Freddy Kreuger violent fashion. Momentum models suggest support is there and the kumo is one of the few to rise in the early months of 2010 so without any drama in the downside moves, we like the overall medium and long term upside prospects and consider dips to be possible opportunities to go long or add longs (as long as the kumo holds but the rising Senkou Span A is favorable to longs in early 2010. Overall, this pair is one of our bull favorites and has a chance to continue being a leader of the pack against the USD.
Chris Capre is the current Fund Manager for White Knight Investments (www.whiteknightfxi.com/index.html). He specializes in the technical aspects of trading particularly using Ichimoku, Momentum, Bollinger Band, Pivot and Price Action models to trade the markets. He is considered to be at the cutting edge of Technical Analysis and is well regarded for his Ichimoku Analysis, along with building trading systems and Risk Reduction in trading applications. For more information about his services or his company, visit www.2ndskies.com.