Expiration
From a
one-day Intel
(
INTC |
Quote |
Chart |
News |
PowerRating) demise — of
course, that was after a +29% semiconductor move in four days — to an IBM
explosion yesterday where the stock closed at 72.21, +11.3%. In the semis,
(
NVLS |
Quote |
Chart |
News |
PowerRating),
+11.7%,
(
KLAC |
Quote |
Chart |
News |
PowerRating), +10.2%, and
(
AMD |
Quote |
Chart |
News |
PowerRating), +24.1%, had big days, and Intel
finished +5.2%. The SOX ended +8.7%. NYSE volume was 1.7 billion, volume ratio
of 72, and breadth +1243. The SPX
(
$SPX.X |
Quote |
Chart |
News |
PowerRating) ended +2.2%, the Dow
(
$INDU |
Quote |
Chart |
News |
PowerRating)
+3.0% and Nasdaq
(
$COMPQ |
Quote |
Chart |
News |
PowerRating) +3.2%.
We had good Trap
Doors yesterday that saw the
(
SPY |
Quote |
Chart |
News |
PowerRating)s and
(
DIA |
Quote |
Chart |
News |
PowerRating)s drop about 2.0% from
their highs in the first 15 minutes of frenzy. The best was the Diamonds that
hit an intraday high of 83.70 on the opening bar, and this was also the 2.0
volatility band. It dropped to 82.40 by the 10:00 a.m. ET bar. The initial DIA
move was exaggerated by the IBM frenzy. Yes, folks, the same stock the analysts
had hyped down to 54 five days ago. As a trading friend of mine said yesterday,
they have now been reduced to reporters, much in part due to the fair disclosure
rule, as companies keep parading to the podium with changes in their forecast.
You know the drill: Originally $1.00, then reduced eventually to 45 cents, and
they report 55 cents, beating the 45 cent reduced estimate by 22%, and the media
empty suits jump all over it pounding the bullish table. Just once I would like
them to refer to how many reduced estimates there were before the final number
is announced. The analysts are also tripping over each other to put out
downgrades and sell recs to show they have turned a new leaf, so there is a
constant dislocation of information as there are so many different opinions
between the various brokerage firms.
^next^
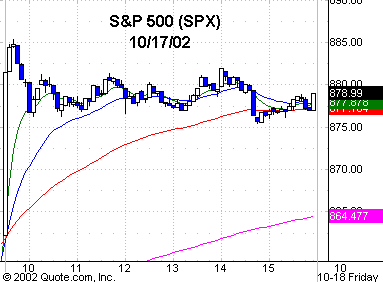
The SPX ran right to
885.33 on the 9:40 a.m. bar, and then went sideways in a 7 point narrow range
between 882 and 875, closing at 879.20. That doesn’t surprise me, as the .50
retracement to the 1987 low is 884 and the .618 retracement to 965 from 769 is
890. This is the first time approaching these numbers during this rally, so
there is usually some churning or a possible reversal in the zone. We will see
next week where the bias is usually a bit weak following expiration, and also
into the major cycle dates Oct. 18 and Oct. 21. Don’t be tempted to play
position catch up at these levels. Your next decision will come on a
pullback to the 769 low or a short entry decision at resistance if there is a
reversal entry pattern.
Keep in mind that the
last three significant rallies for the SPX to declining longer-term moving
averages were +21.7% to the May 21, 2001, 1316 high, then a +24.5% move from the
September ’01 945 low to an 1177 high, and then the July 24 776 low to the Aug.
22 high, which was a +24.3% move. The SPX is now up +15.2% low to high so far. A
20% move from the 769 low would translate to 922, and that is also the .786
retracement to the 965 high.
^next^
If this RST proves to be
the bottom, then we are in leg 1 of a new up market. Position decision will come
on some Fib pullback to 769, and the second decision on a move above the 2
point, which would be the high of this current initial leg. That would be the
third Eliot Wave leg, and always the biggest percentage move which forces
everyone into the game. Until shown otherwise, these are the near-term
parameters above and below, and only the market can show us something different.
I am doing this Thursday
night for Friday, so I don’t know how the pre-opening futures game is being
played out. Be careful with the expiration chop, and at these levels reached in
such a short time frame, there is no good edge.
Have a good trading day
and have a great weekend.

Five-minute chart of
Thursday’s SPX with 8-, 20-,
60- and 260-period
EMAs

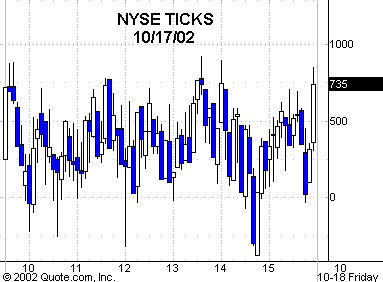
Five-minute chart of
Thursday’s NYSE TICKS
