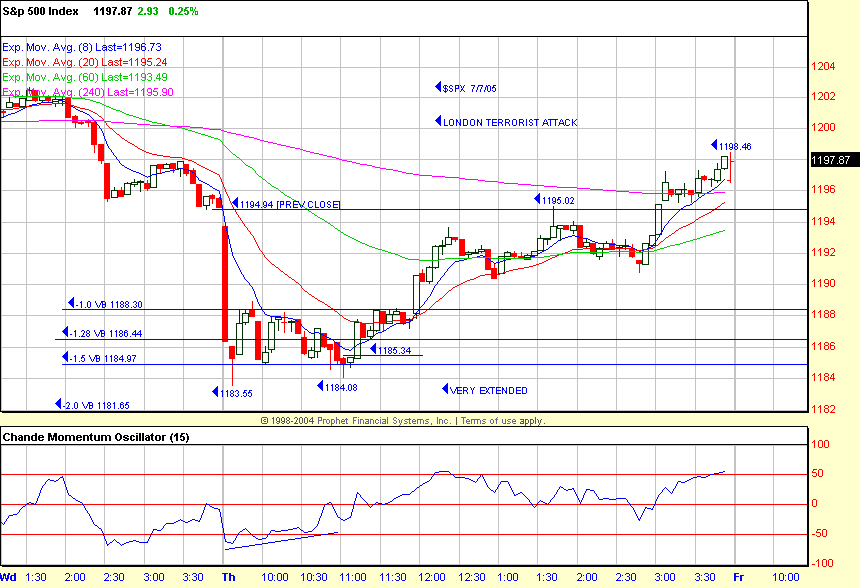
Extended Price Decline Provided Good Opportunity Yesterday
After a violent terrorist attack in London, the
SPX
(
$SPX.X |
Quote |
Chart |
News |
PowerRating) traded down to 1183.55 on the 9:35 a.m. ET bar, which proved
to be the intraday low. This extended price level was vs. the -1.5 volatility
band of 1184.97 and -2.0 volatility band at 1181.64. There was a quick reflex to
1188.92, then a retest of 1183.55 and then volatility reverted to the mean as
the SPX went trend up to 1198.46, closing at 1197.87, +0.3% on the day. I would
bet that the “Plunge Protection Team” was involved early yesterday morning to
avoid any downside from getting out of hand.
The down volume outpaced up volume by a ratio of
5:1 at 10:00 a.m. with gold the leading sector and the
(
TLT |
Quote |
Chart |
News |
PowerRating) +0.7%. The XLB
(basic materials SPDR) led the red sectors at that time, -1.4%, so that price
action was not abnormal based on the situation. At day’s end, the XLE was +1.3%
and
(
SMH |
Quote |
Chart |
News |
PowerRating) +1.2%, leading the sectors. The Dow
(
$INDU |
Quote |
Chart |
News |
PowerRating), 10,302,
(
QQQQ |
Quote |
Chart |
News |
PowerRating), 37.06, and Nasdaq
(
$COMPQ |
Quote |
Chart |
News |
PowerRating), 2075.66, were all +0.3%. NYSE
volume expanded to 1.52 billion shares with the volume ratio 50 and breadth
+318, so those traders who took advantage of the extended price declines after
the attacks had an excellent trading day.
Daytraders also caught some nice moves in the
energy sector, such as the XLE breakout of a Slim Jim above 46, trading to
46.56, and an
(
APC |
Quote |
Chart |
News |
PowerRating) Slim Jim breakout above 86.40 which ran to an 89.22
intraday high with no stop out threat. These are just two energy examples of
many similar setups.
For today, the early futures are green with the
S&Ps +3.30, Dow +27 and Nasdaq +7.5. Why do I get the feeling that it is a “You
can’t hurt our markets” induced situation by the PPT because it certainly can’t
be for the very dubious method how the jobs data is calculated.
SPX 1200 is the initial 816 EMA (five-minute
chart) which is the same as the 34 EMA on your 120-minute chart, and this can be
an early focus level today. The 480 EMA is 1197.67 and 240 EMA 1195.91.
It is not your normal market when the Fed’s
Protection Team is active to stem the downside and Programs become a much larger
percentage of the daily volume and random price movement, especially around
month- and quarter-ending periods. For example, the NYSE program percentage
participation was 53.3% for the week ending 06/07, 61.5% 06/24 and a huge 76.3%
07/01 into the June quarter end with all of the rebalancing and reallocations.
Daytraders should be very nimble in this market, especially through July and
August, by keeping your position size a bit smaller and/or taking some profits
earlier in the trade and moving to breakeven sooner.
Have a good trading day and a great weekend,
Kevin Haggerty
P.S. I will be
referring to some charts here:
www.thechartstore.com in the future.

