Failed attempt at rally for gold?
Last week we talked about an
important market test being made by commodities, oil and precious
metals in the markets, that investors should watch closely, FROM THE SIDELINES.
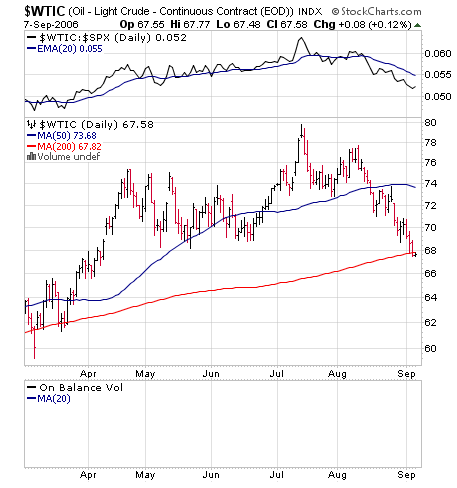
Crude appears on the verge of breaking important support at
both the 200 ma and at the last low at 68 as shown above. A clear weak close on
high volume below current levels will be the first break below a prior low in
crude oil since 2003, and the first trendline break down on a weekly chart since
then, and setup a test of the 55-62 support level. It will also likely confirm
that the growth slowdown we’ve been pounding the drum about since March of this
year, is likely getting more teeth.
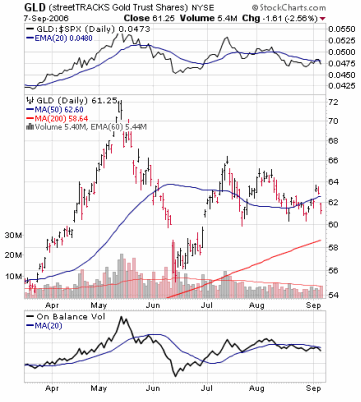
We also talked last week about a critical test for gold and
gold stocks, and how a break down below 60 or breakout over 64 in
(
GLD |
Quote |
Chart |
News |
PowerRating) would
likely tell the tale of the direction of the next intermediate-term move.
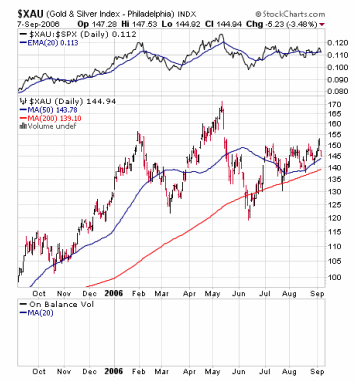
Interestingly,
(
XAU |
Quote |
Chart |
News |
PowerRating) appeared to breakout earlier this week, while GLD failed to
move above the 64 level we mentioned, and with today’s big breakdown in gold and
gold stocks, it appears that the XAU breakout occurring without GLD was a
fake out. The triangle in GLD remains in force with 60 and 64 being critical
levels, though a false breakout in XAU does not portend upside action. Continue
to watch the 60 level in GLD closely.
The CRB has broken 330 and its 200 ma and may be the first of
the charts we highlighted last week to give a bearish signal. Follow through by
Crude may well be next and very close at hand. If GLD then follows with a move
under 60, it will be a clear indication that the first significant correction in
commodities is underway, and likely suggest that the growth slowdown is starting
to dominate market opinion more thoroughly.
Materials stocks have been underperforming since May and look
similar to GLD.
(
IYM |
Quote |
Chart |
News |
PowerRating), the materials i-share is stuck in a triangle and its
breakout of this pattern could be used to confirm a plurality of positive or
negative moves by GLD, oil, and commodity indexes to help investors ascertain
whether there will be some breathing room for a spell or a quick move toward the
slowdown that is developing economically. If these can all hold and move above
resistance higher, the market should be able to move irregularly higher for some
weeks before fears of the slowdown begin to exert more influence. But if these
all breakdown, the market will likely have trouble not reacting negatively to
the growing focus of economic slowdown ahead.

Our concern now that we’re in the worst seasonal month of the
year with the second seasonally worst month next month, is that if evidence of
the growth slowdown mounts here, it will lead to some downside volatility.
Housing indexes are falling at a swift enough pace now, that investors,
particularly those with lingering net long exposure, should begin to watch out
for a clear plurality of indicators showing that the focus is shifting toward
fear of the growth slowdown. We suspect this will develop at some point before
the end of the year.

Internal breadth is improving some, but is still below levels
normally associated with a sustainable bull market move. We continue to rate the
macro environment as not highly reliable (except perhaps for bonds and TLT,
which are likely to beat cash as the US slows down and have broken out of a base
recently). Investors should continue to skeptically let market action be the
guide. Strong rallies in the major averages accompanied by high volume to create
a couple more follow-through days would be the first sign of more upside ahead.
The real excitement may not come until the breadth of Top RS new highs starts to
expand broadly and stocks meeting our runaway up fuel criteria begin to break out
with some plurality. Until then, we still suggest keeping your powder mostly
dry. We continue to suspect that breaking above 1320-27 and making new highs
will be difficult for the market to do unless better volume and breadth
materializes. We continue to regard this as a TREACHEROUS ENVIRONMENT where
CAPITAL PRESERVATION SHOULD BE PARAMOUNT. Don’t allocate heavily to anything
that doesn’t scream at you.

Lots of bonds and cash seem prudent here until the environment
becomes clearer. Long/short pairs can be sparingly participated in as well.
Our model portfolio followed in TradingMarkets.com with
specific entry/exit/ops levels from 1999 through May of 2003 was up 41% in 1999,
82% in 2000, 16.5% in 2001, 7.58% in 2002, and we stopped specific
recommendations up around 5% in May 2003 (strict following of our US only
methodologies should have had portfolios up 17% for the year 2003) — all on
worst drawdown of under 7%. This did not include our foreign stock
recommendations that had spectacular performance in 2003.
Our US selection methods, our Top RS/EPS New Highs list
published on TradingMarkets.com, had readings of 24, 23, 33 and 12 with 11
breakouts of 4+ week ranges, no valid trades meeting criteria, and no close
calls. This week, our bottom RS/EPS New Lows recorded readings of 2, 3, 3 and 5
with 2 breakdowns of 4+ week ranges, no valid trades and no close calls. The
“model†portfolio of trades meeting criteria has some time back exited all
positions and is 100% in cash.

Mark Boucher has been ranked #1 by Nelson’s World’s Best Money Managers for
his 5-year compounded annual rate of return of 26.6%.
For those not familiar with our long/short strategies, we suggest you review my
book "The Hedge Fund Edge", my course “The
Science of Trading“, my video seminar, where I discuss many new techniques,
and my latest educational product, the
interactive training module. Basically, we have rigorous criteria for
potential long stocks that we call “up-fuel”, as well as rigorous criteria for
potential short stocks that we call “down-fuel".
