False And True Breakdown
Breakdown players love
to see when a stock falls below a popular moving average, such as the 50-day
average. I know many traders and investors believe that once a stock breaks down
below the 50-day moving average, it must be sold. Some investors are even taught
by professionals that stocks should be avoided if they are trading below the
50-day moving average. Indeed, this average is widely watched.
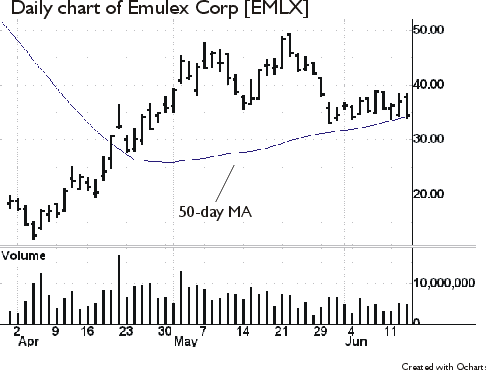
Here is a daily chart of Emulex Corp. (EMLX)
as of the close of yesterday (6/13/01). As you can see, the stock has been
trading just above its 50-day moving average for nearly two weeks. Needless to
say, after closing weak at the low, traders are looking for a potential
breakdown.

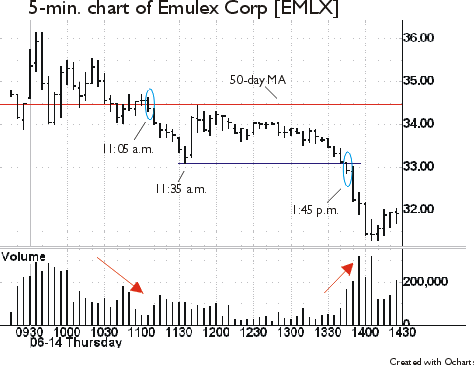
Now, let’s see how traders reacted in today’s session (6/14/01). The chart below
is a five-minute chart of EMLX, and the red horizontal line indicates the level
of the 50-day moving average. After making several false moves, the stock
finally made a breakdown below the red line at 11:05 a.m. But volume was weak.
In fact, Emulex was quickly pushed back to the 50-day moving average and began
to consolidate.

Today’s best move was not a breakdown below the 50-day moving average, but it
happened at 1:45 p.m. when the stock broke down below the intraday low set at
11:35 a.m. Look how volume picked up. EMLX lost nearly 1 1/2 points in less than
30 minutes. Indeed, volume speaks.
